
Billing
Designing how to pay bills, understand charges, and project future spend
Table of Contents


It's Nick, I’m the design lead tasked to improve — along with my crossfunctional team —
improvements to VMware’s Cloud Billing model …
Here’s the backstory. until now, VMware has been operating on a license key-based payments model. Like any key, customers can keep it as long as they like..
As competing companies moved to subscription-based models, VMware has decided to offer subscription-based payments as well …
… but had not fully acknowledged the user-facing and organizational challenges that would come along with this transition.
many of our users are upset. As a result, customer support calls have been rising as customers are unable to understand the details of their bill. Back to the story..

At VMware, the core product team is represented by a designer, a PM, a BE Engineer, and a FE Engineer
This project saw me collaborate very closely with Product Management to drive a design vision along with key features
To drive a design vision, I wanted to solve some key customer pain points we had identified…
… but I also wanted the vision to resonate with my cross-functional stakeholders
… So I analyzed the competitive context, working to identify areas where our solution can have a better, more holistic experience
To do that, I looked at the two market leaders. Here are some of my findings on Amazon AWS
Let's look at the other big competitor in this marketplace, Azure
Azure is strong in managing multiple budgets and projections …
Here, users track spend against a particular budget …
… and here users get an overview of all their budgets
The feature sets vary slightly between the two products …
… but the same design problem exists, a lack of cohesion between the features. I used these findings to drive our product team to think about how our solution could be more integrated, how the experience could be more holistic than our competition.
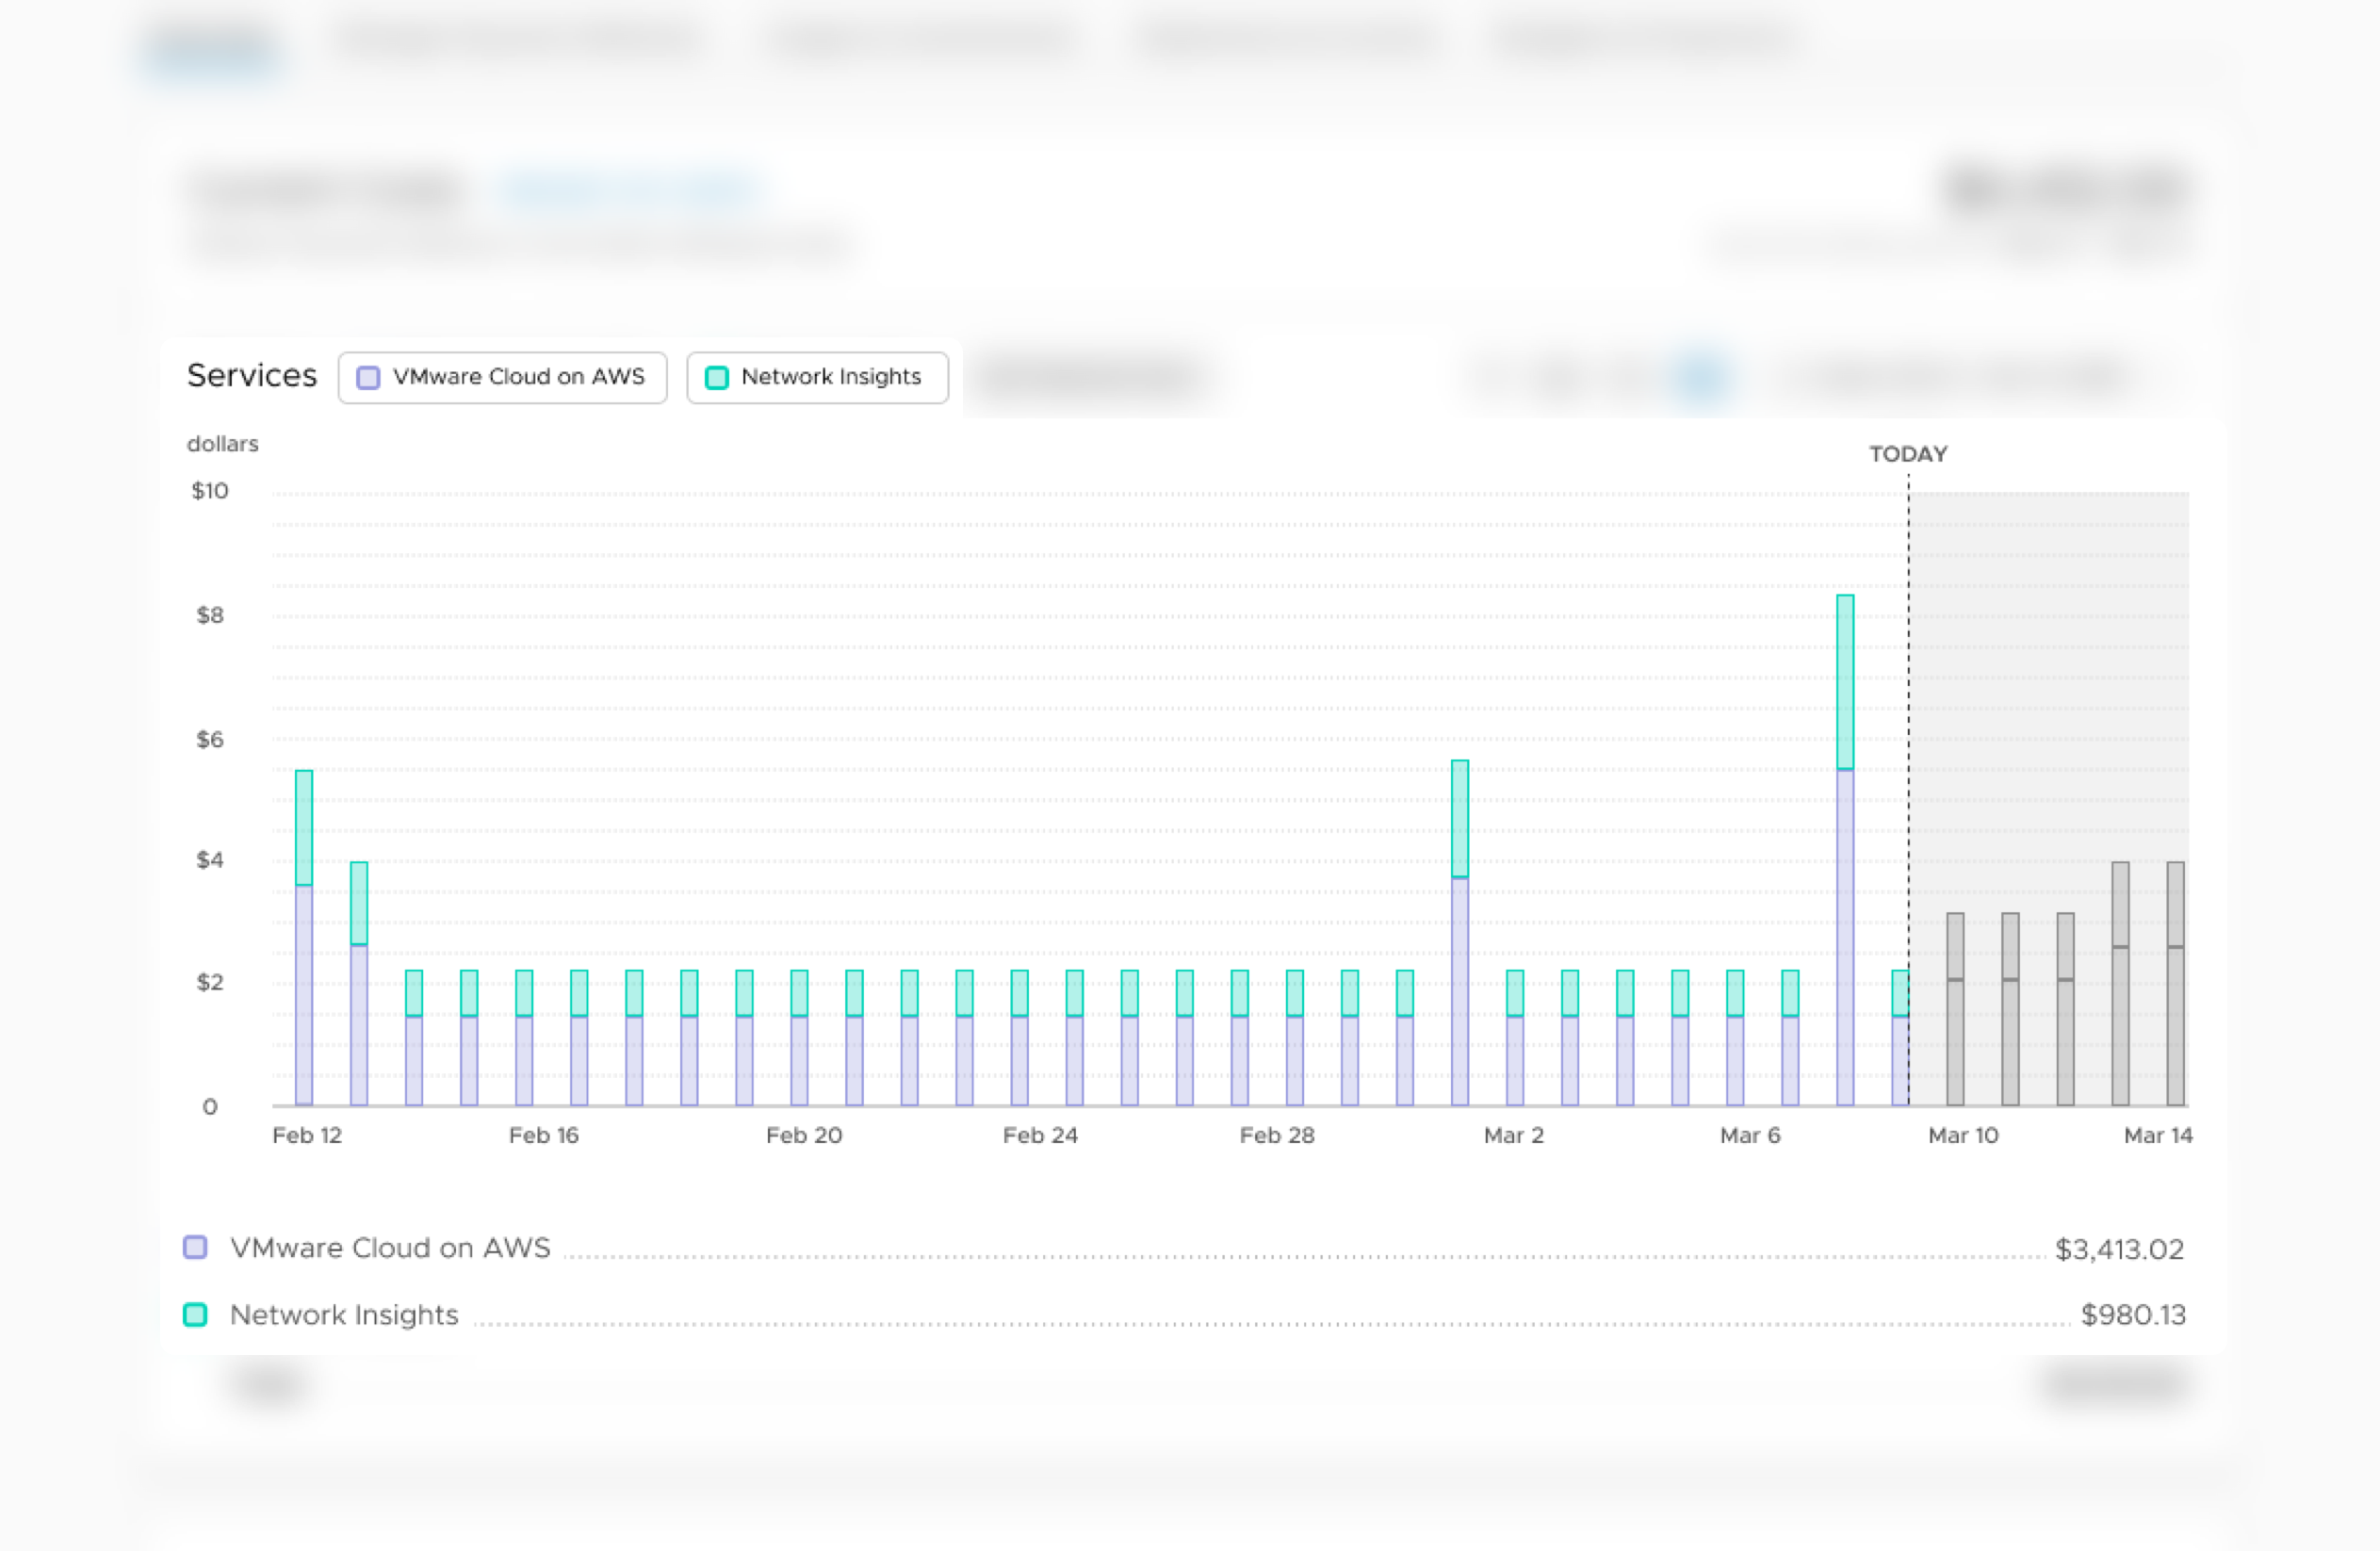
AWS has done a good job of creating robust data visualizations
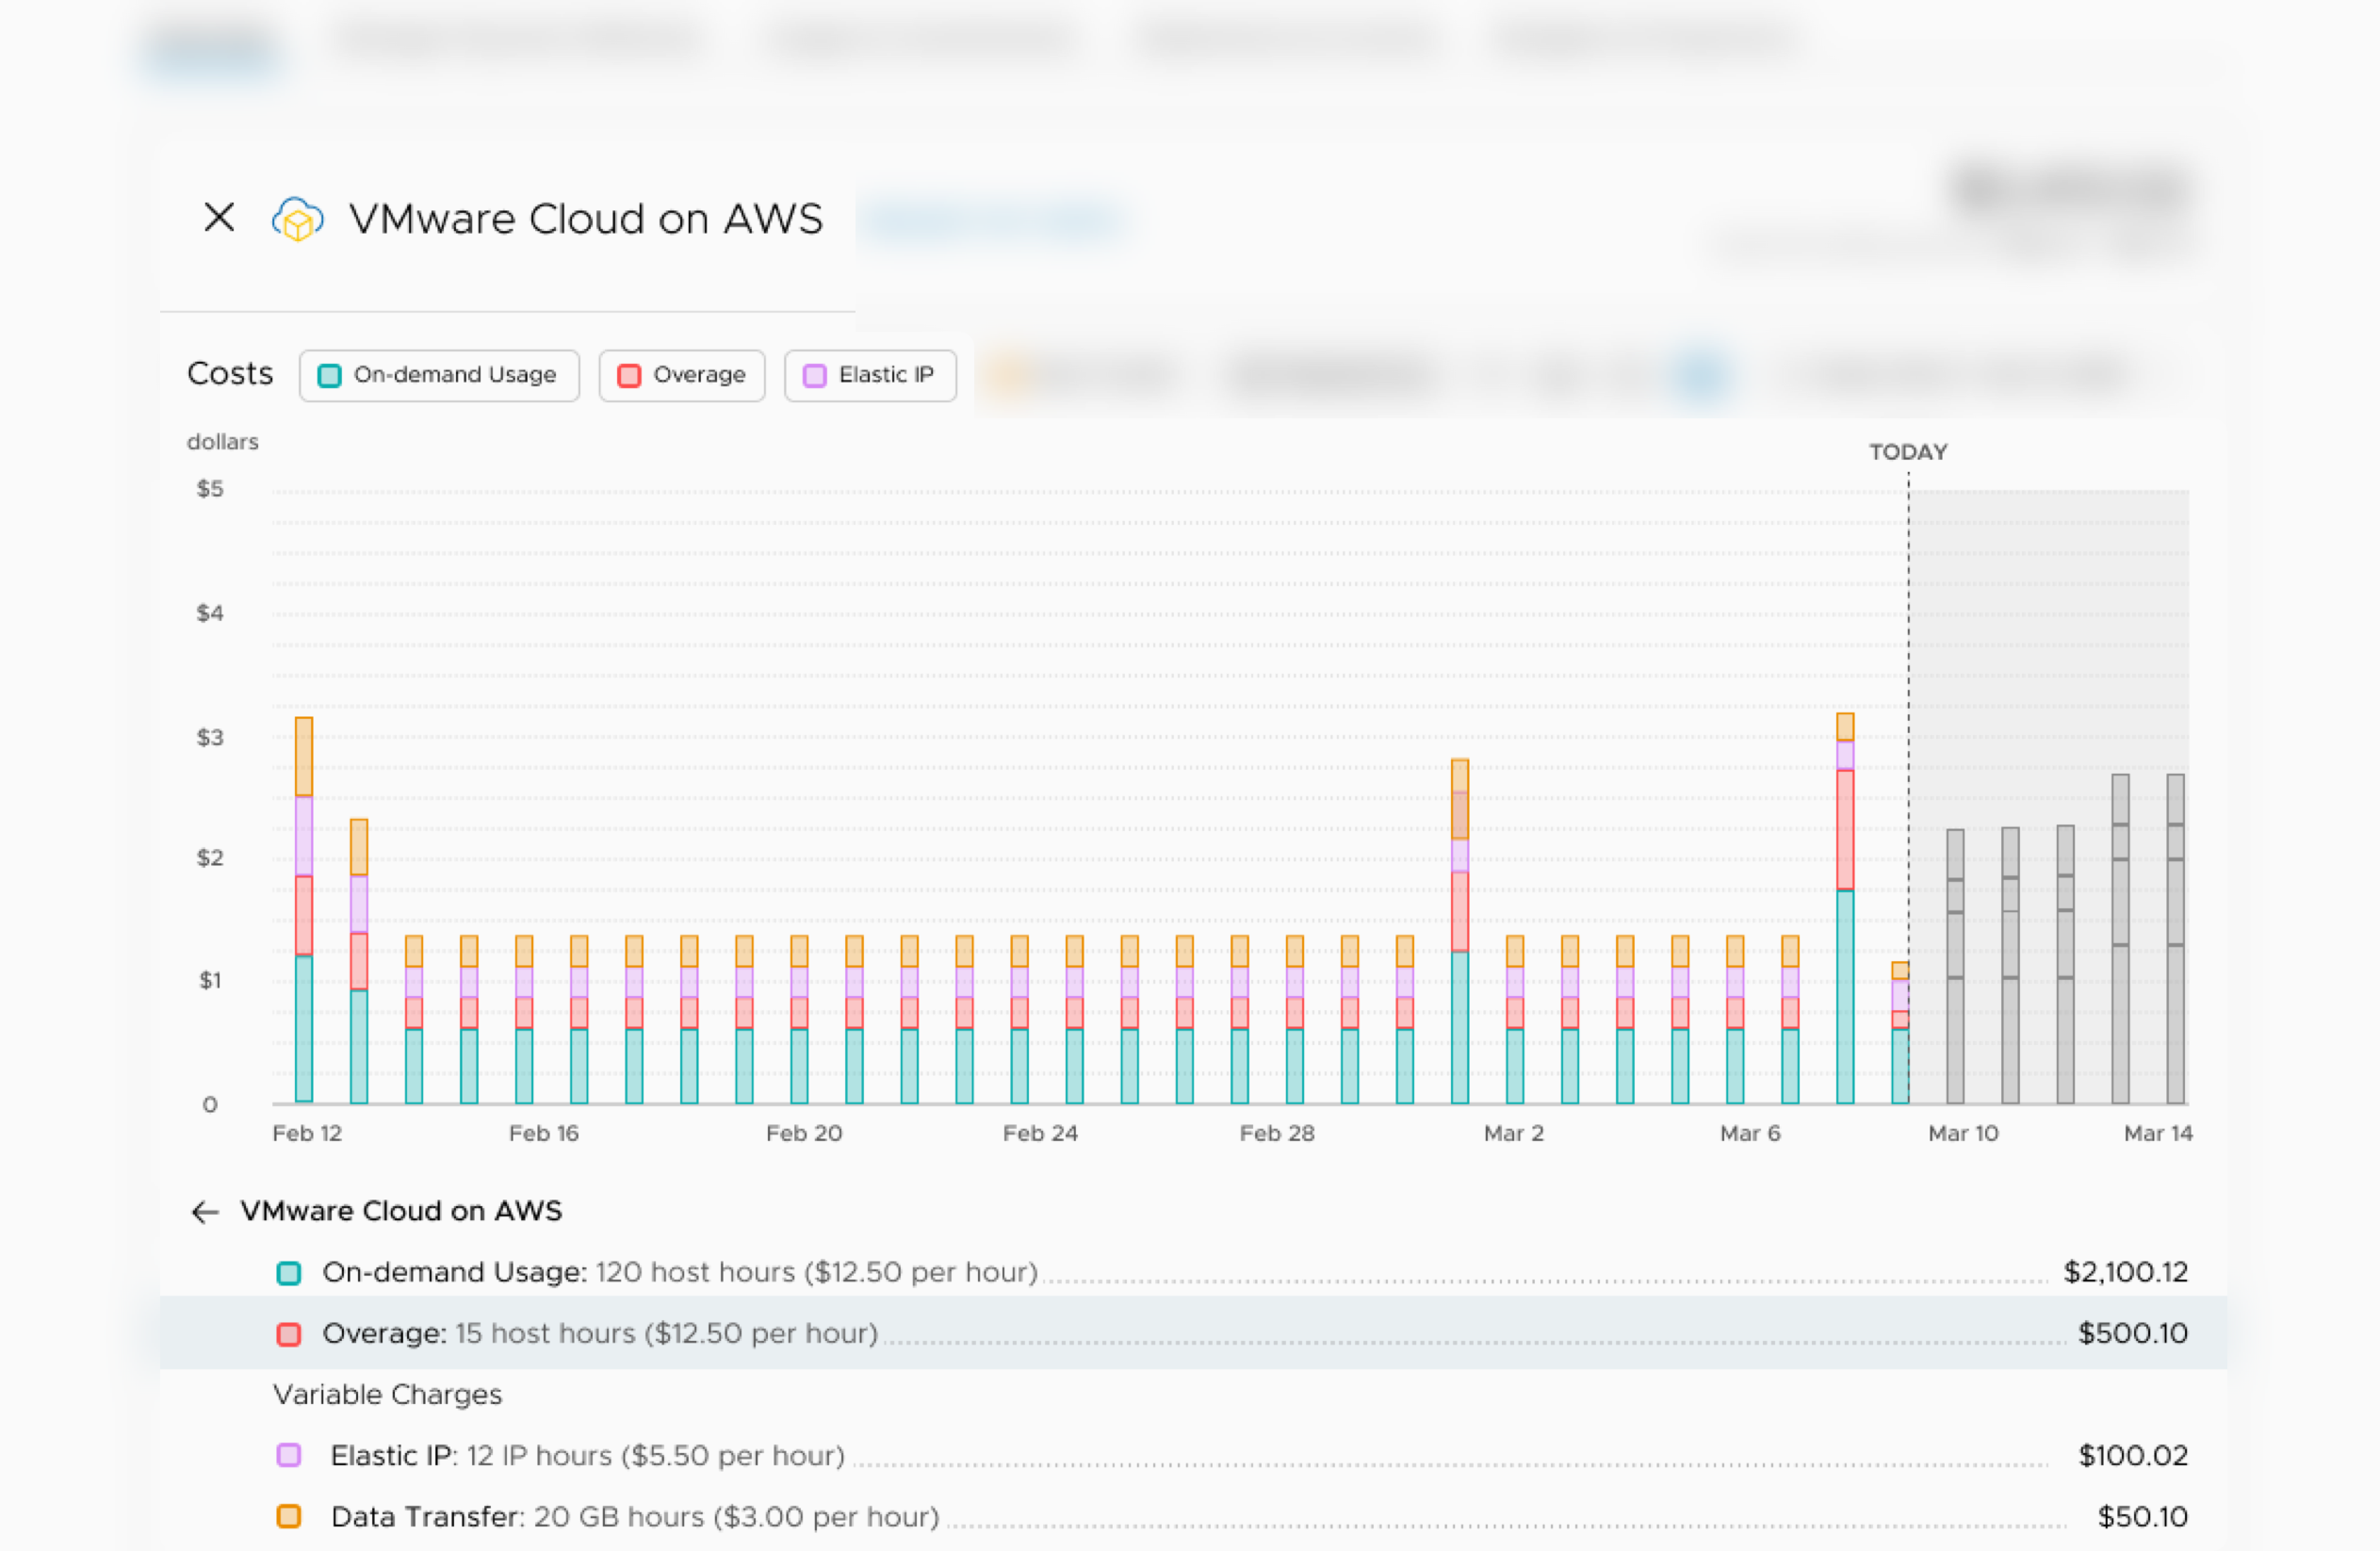
…where users can easily dive into the granular details of their charges
Here, for example, users can compare their spend to their budget
While a lot of great content exists, it's spread out across the UI, disjointed, and disconnected


Once Upon a Time in an IT Department
Once Upon a Time in an IT Department
Bill Rothdale is the Director of IT for Ford Motors.
In his role, he needs to make sure that his team stays efficient …
… and that the department’s bills get paid and its budget is on track
He's had a hard time migrating to VMware's new cloud billing model, though …
… reporting that it is difficult to understand, its details confusing
The Competitive Context
The Competitive Context
The Competitive Context


It made sense to think about this as a new full page view in the broader Billing experience…
… I influenced the product team to think about how the new features could fit into overall improvements to consuming billing data
One pain point kept coming up throughout the user research …
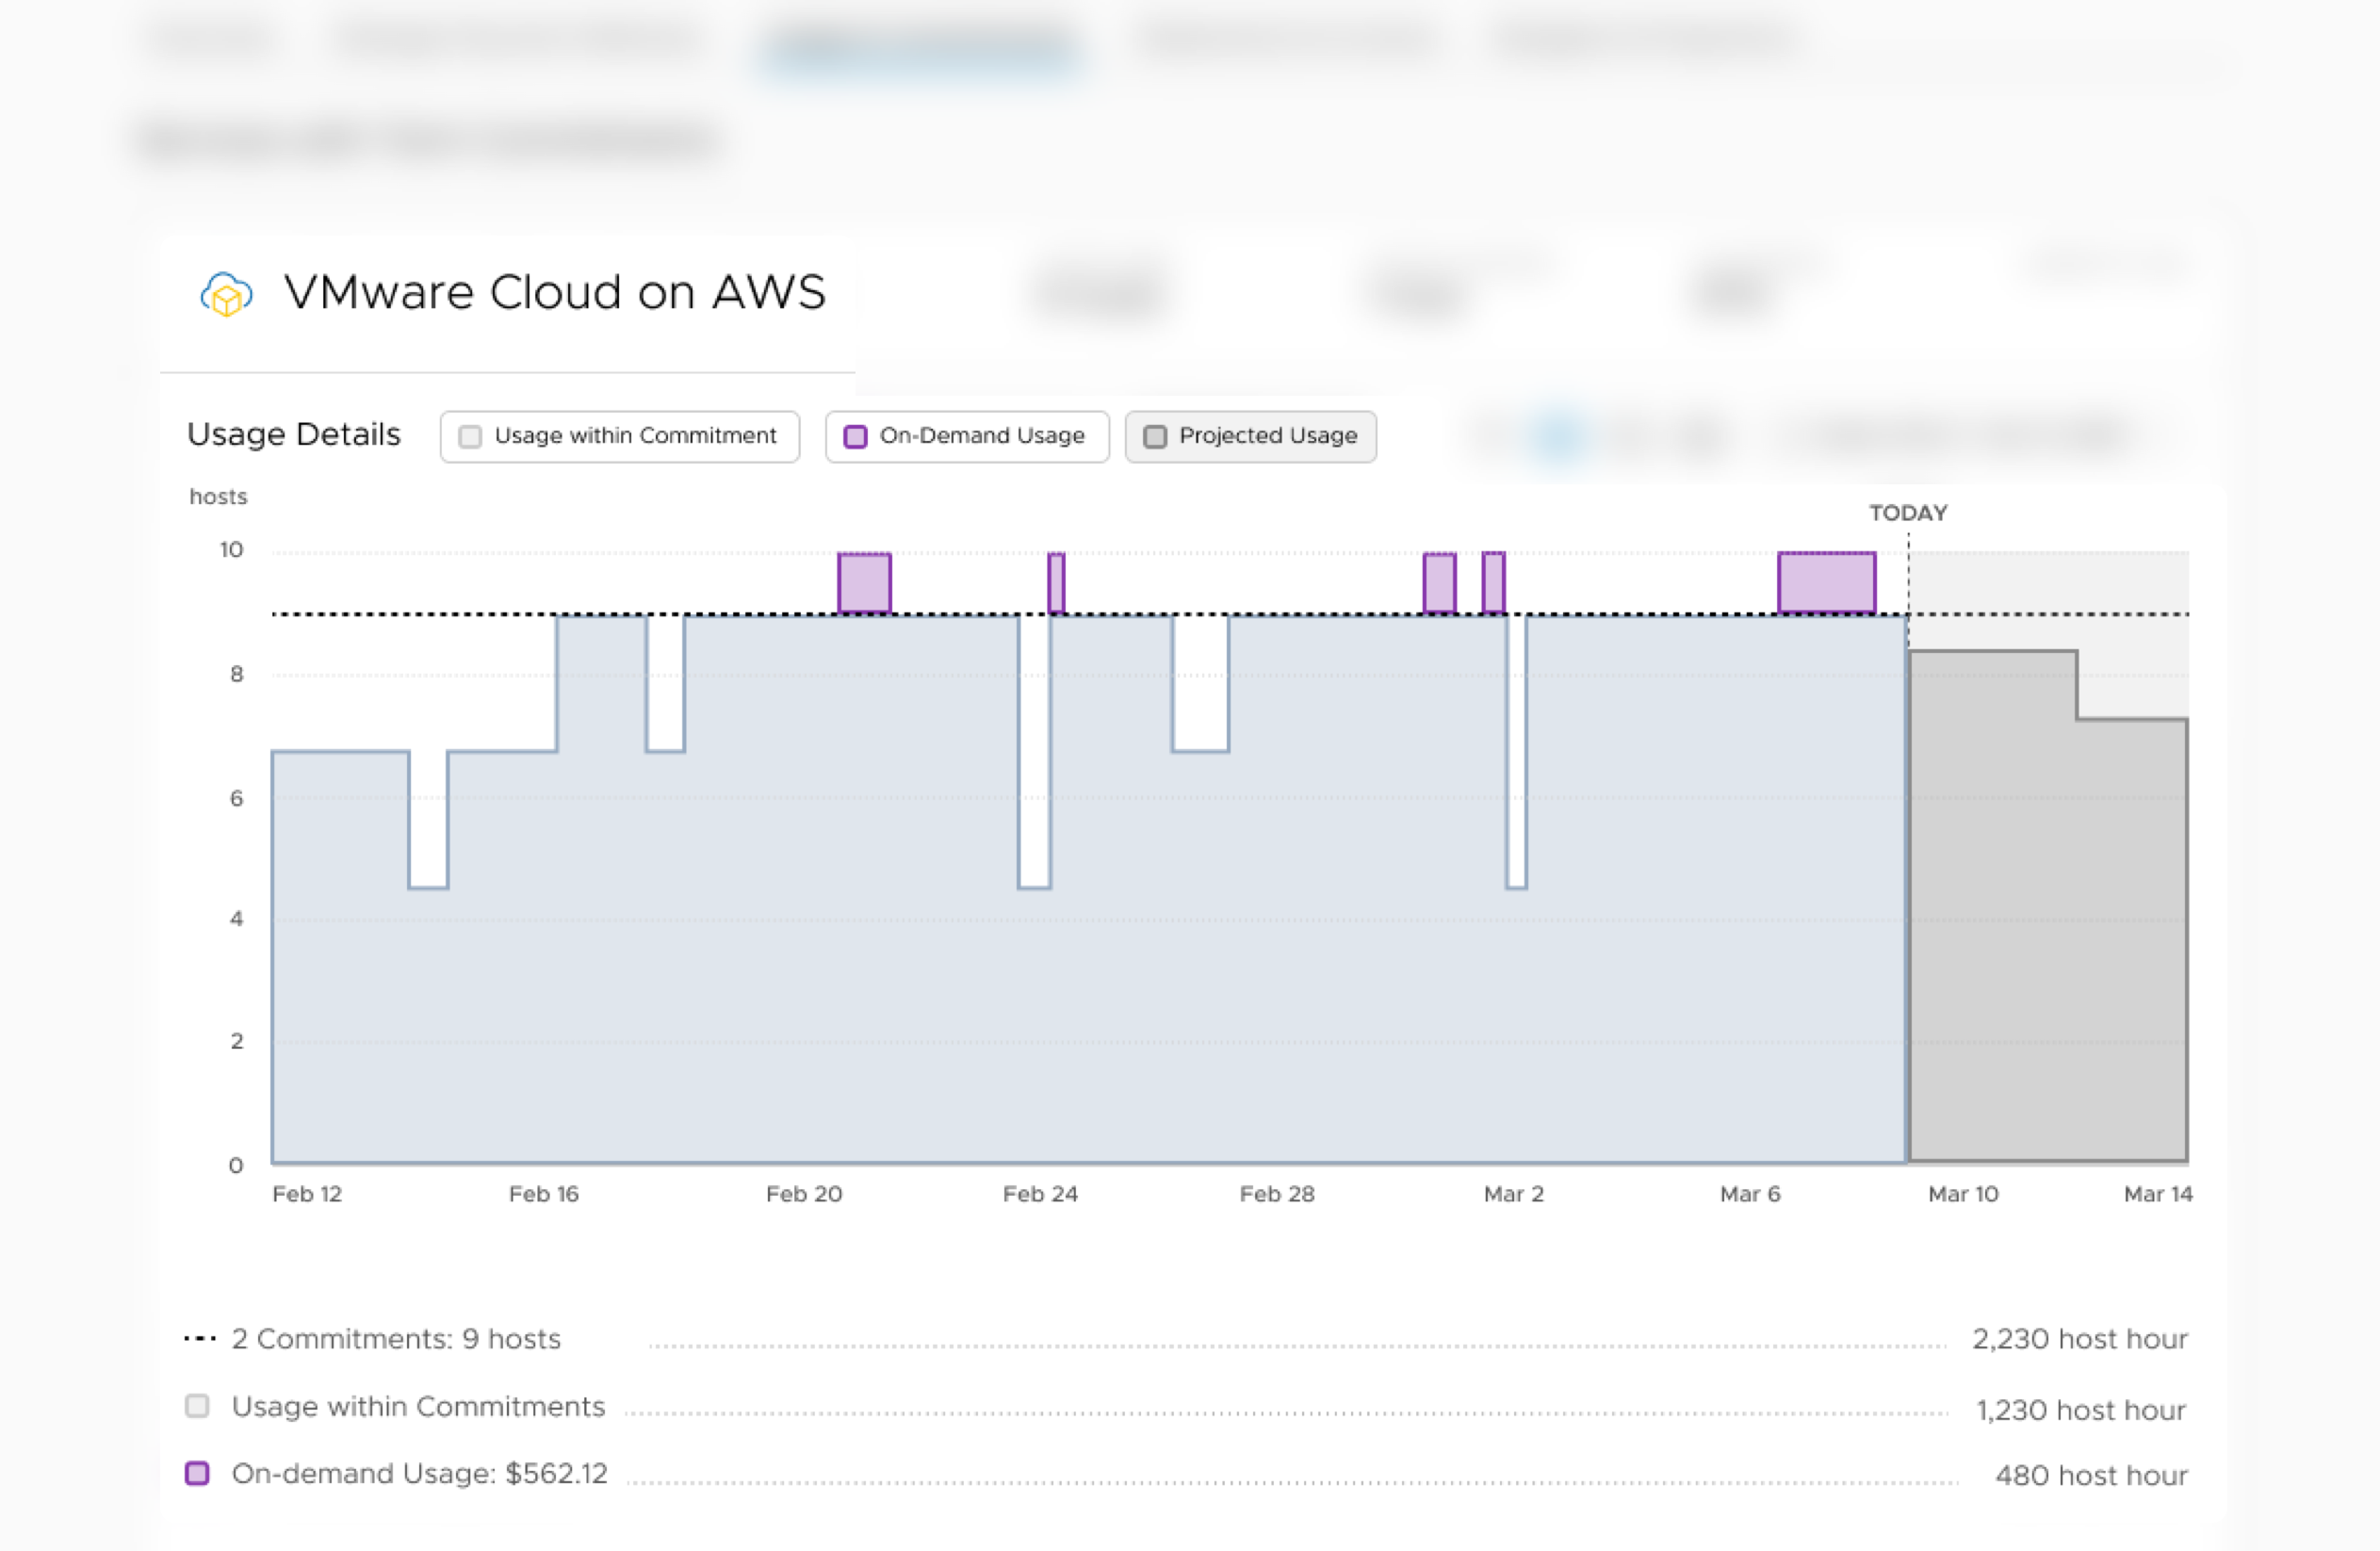
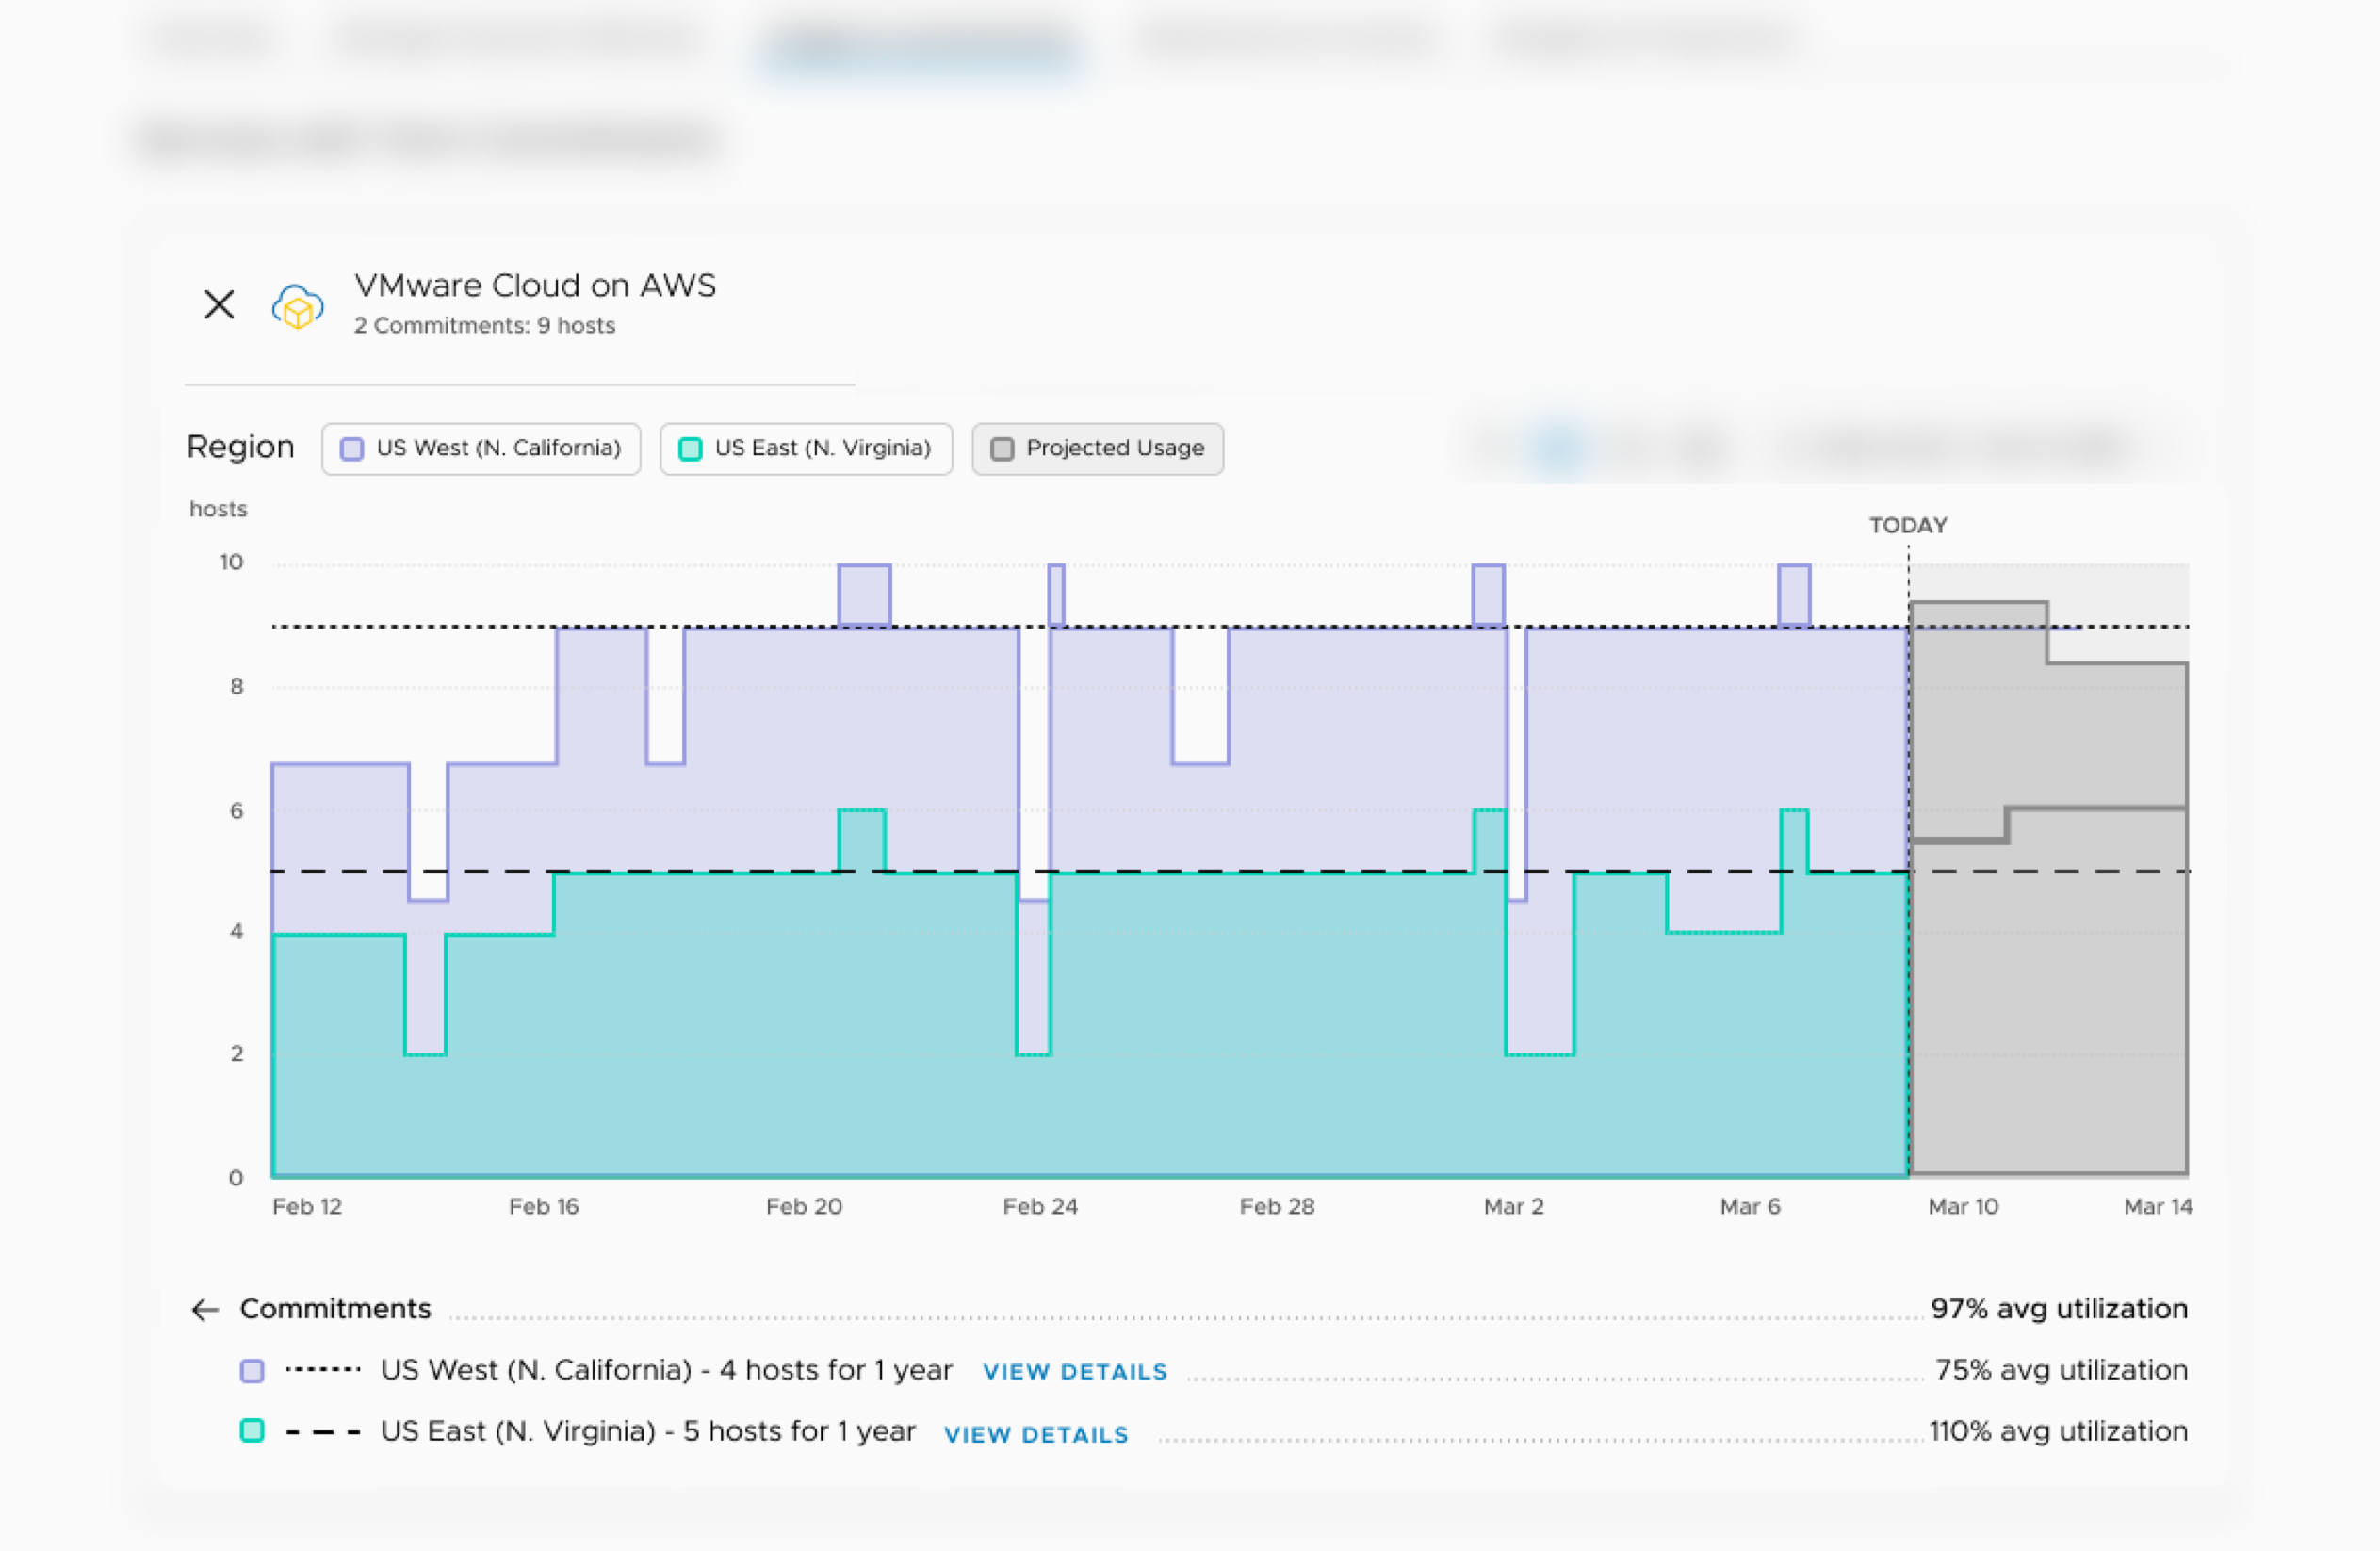
… I thought we could help alleviate this by allowing users to navigate from high level views of their bill into more details
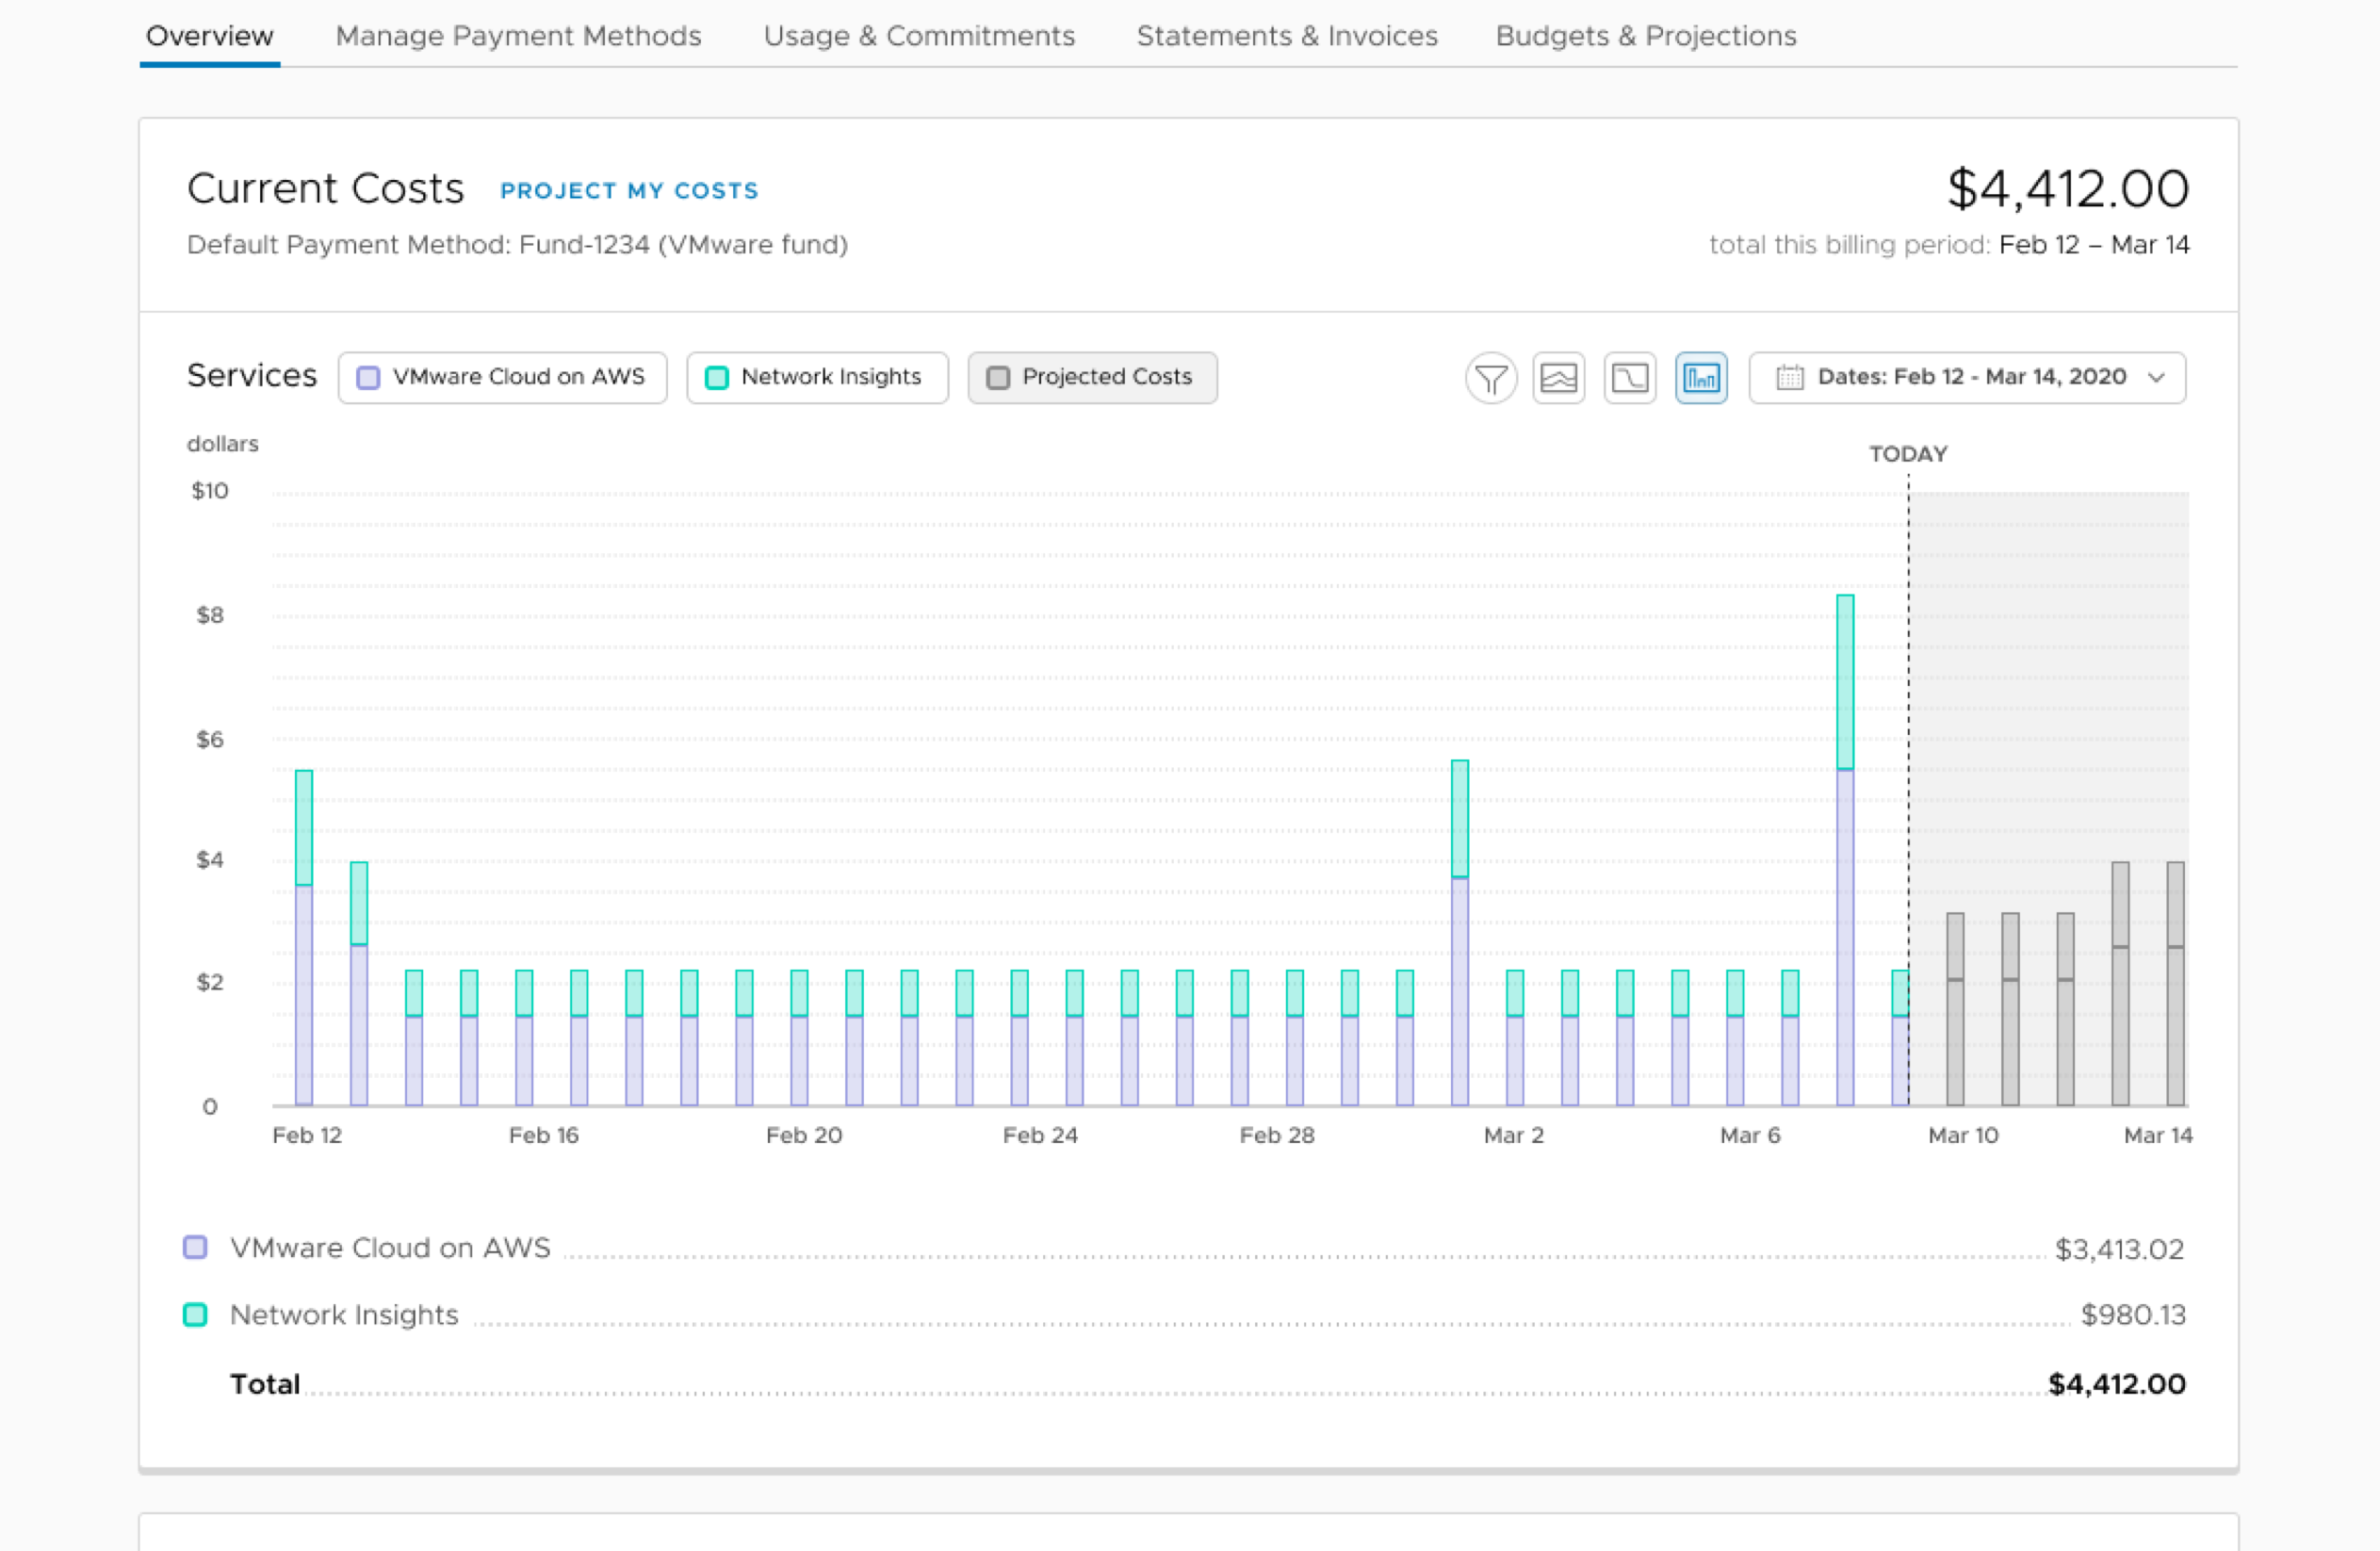
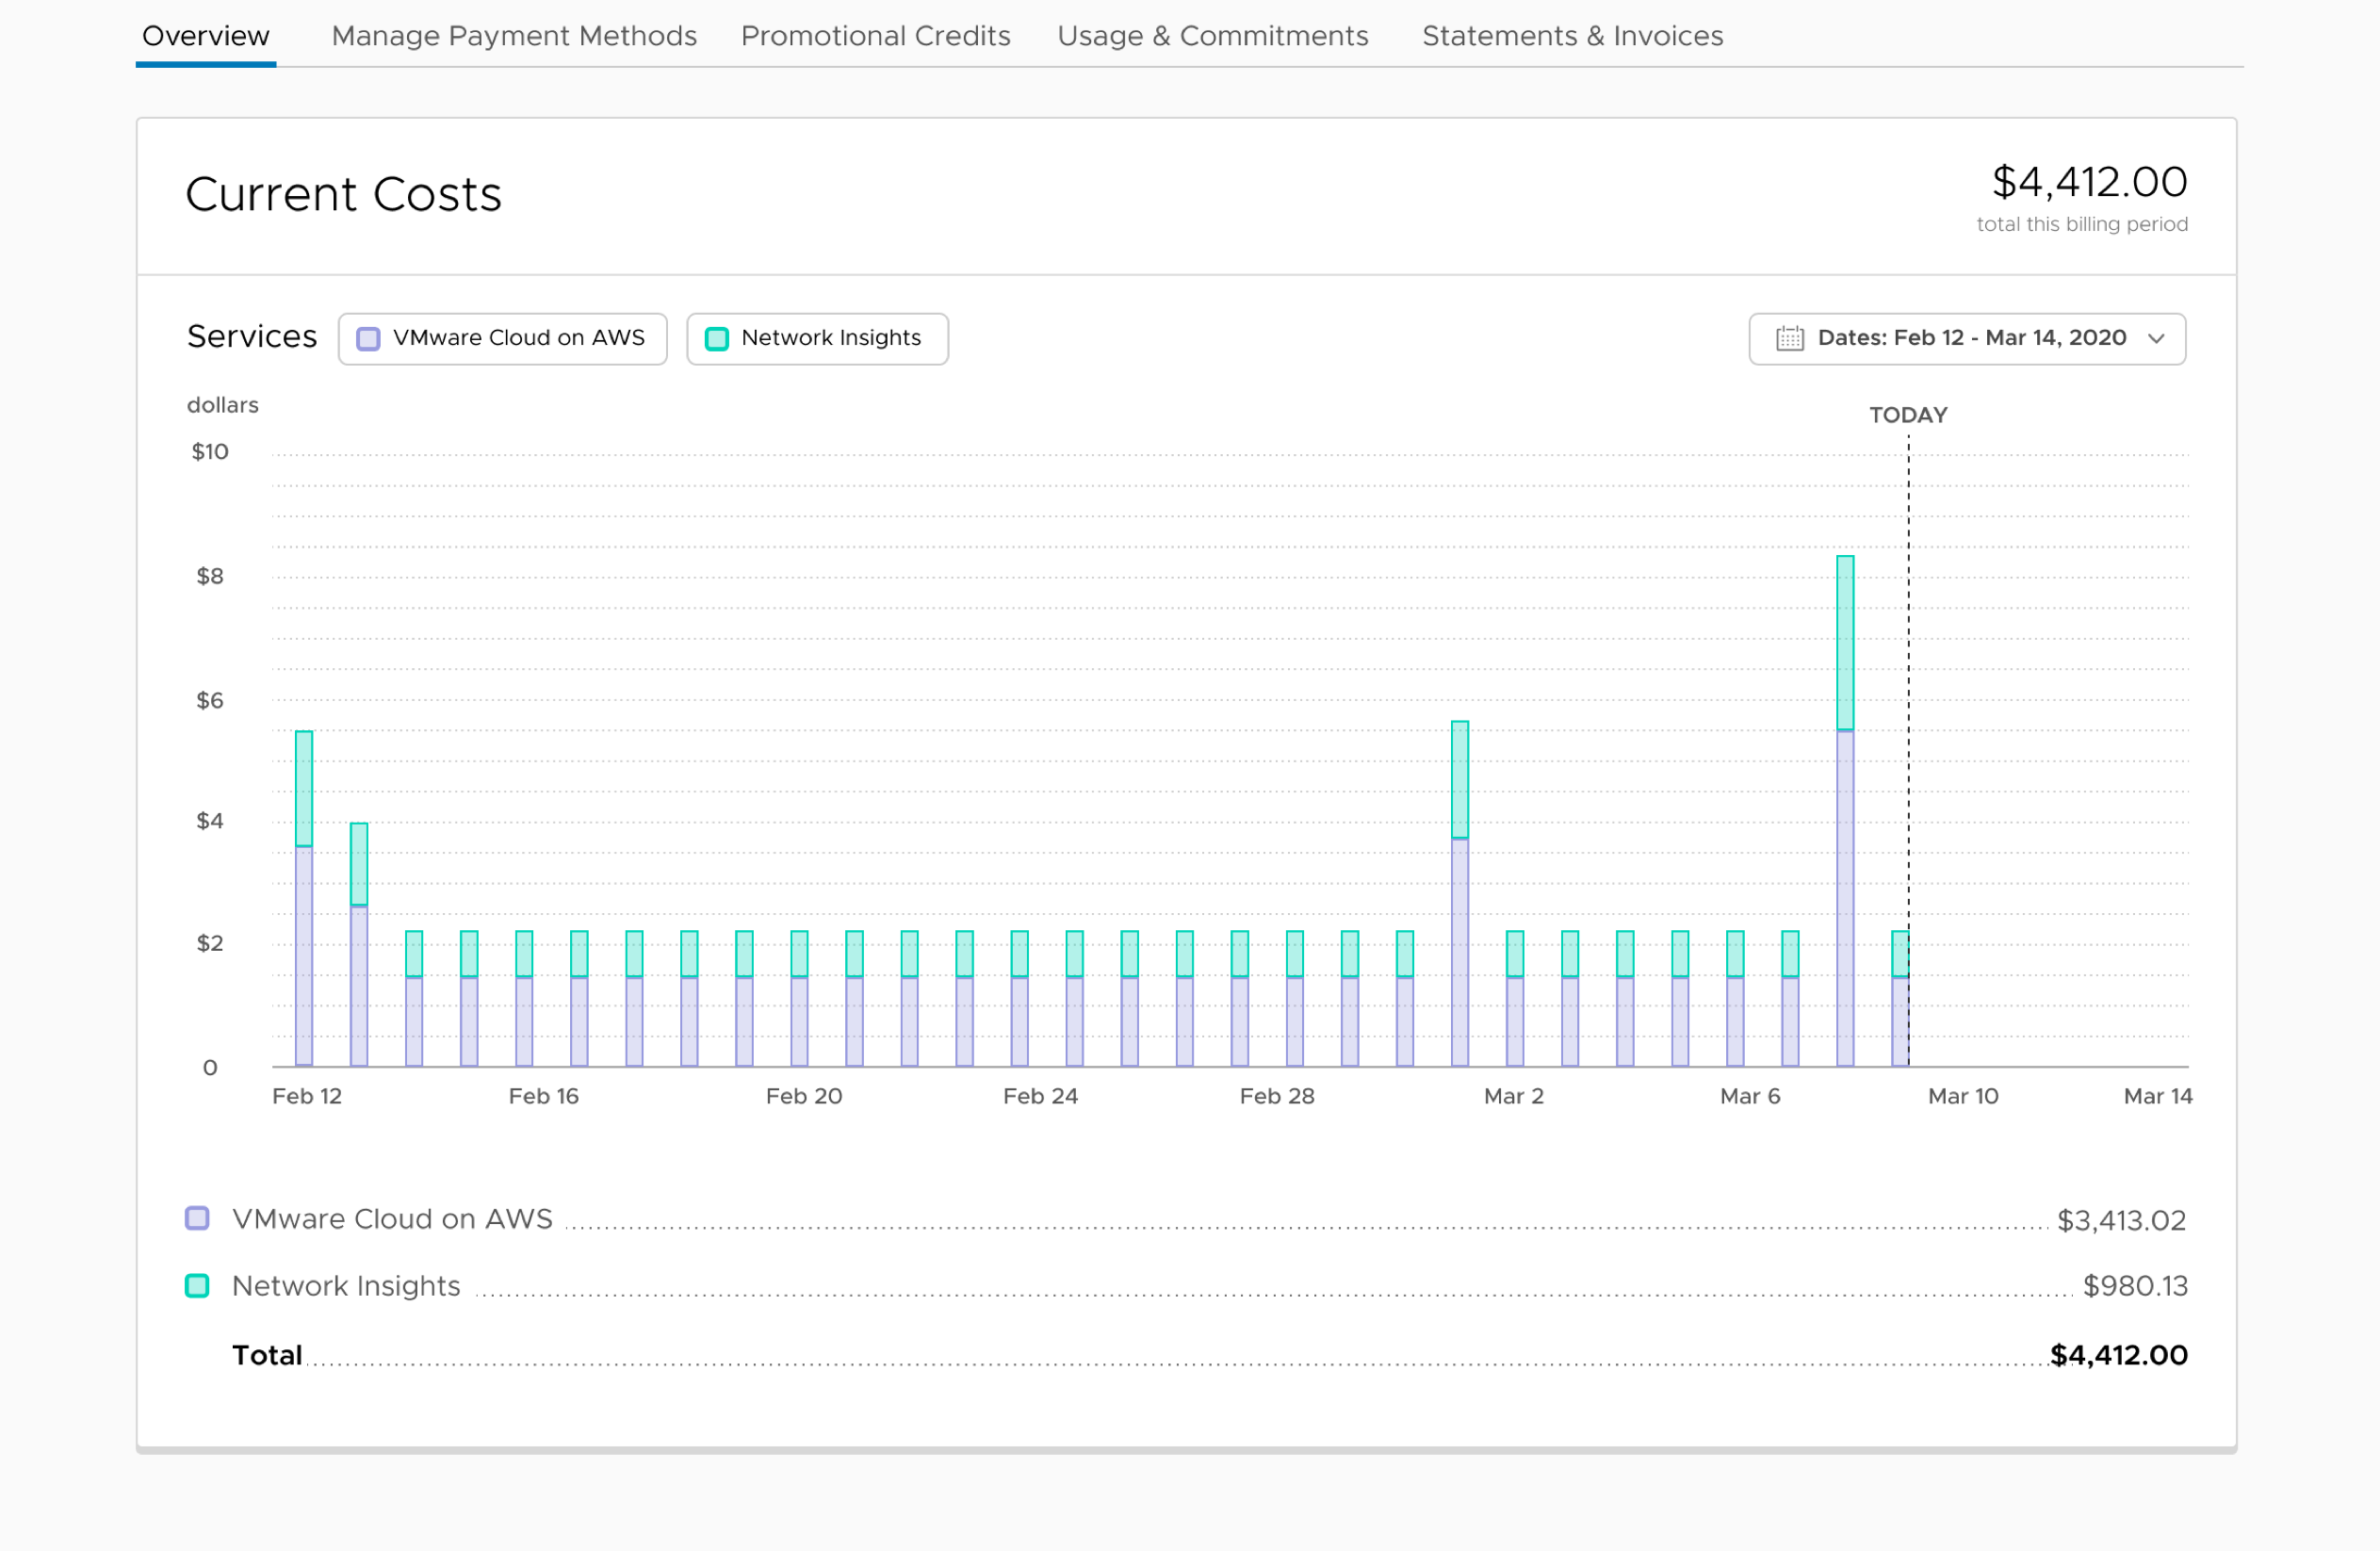
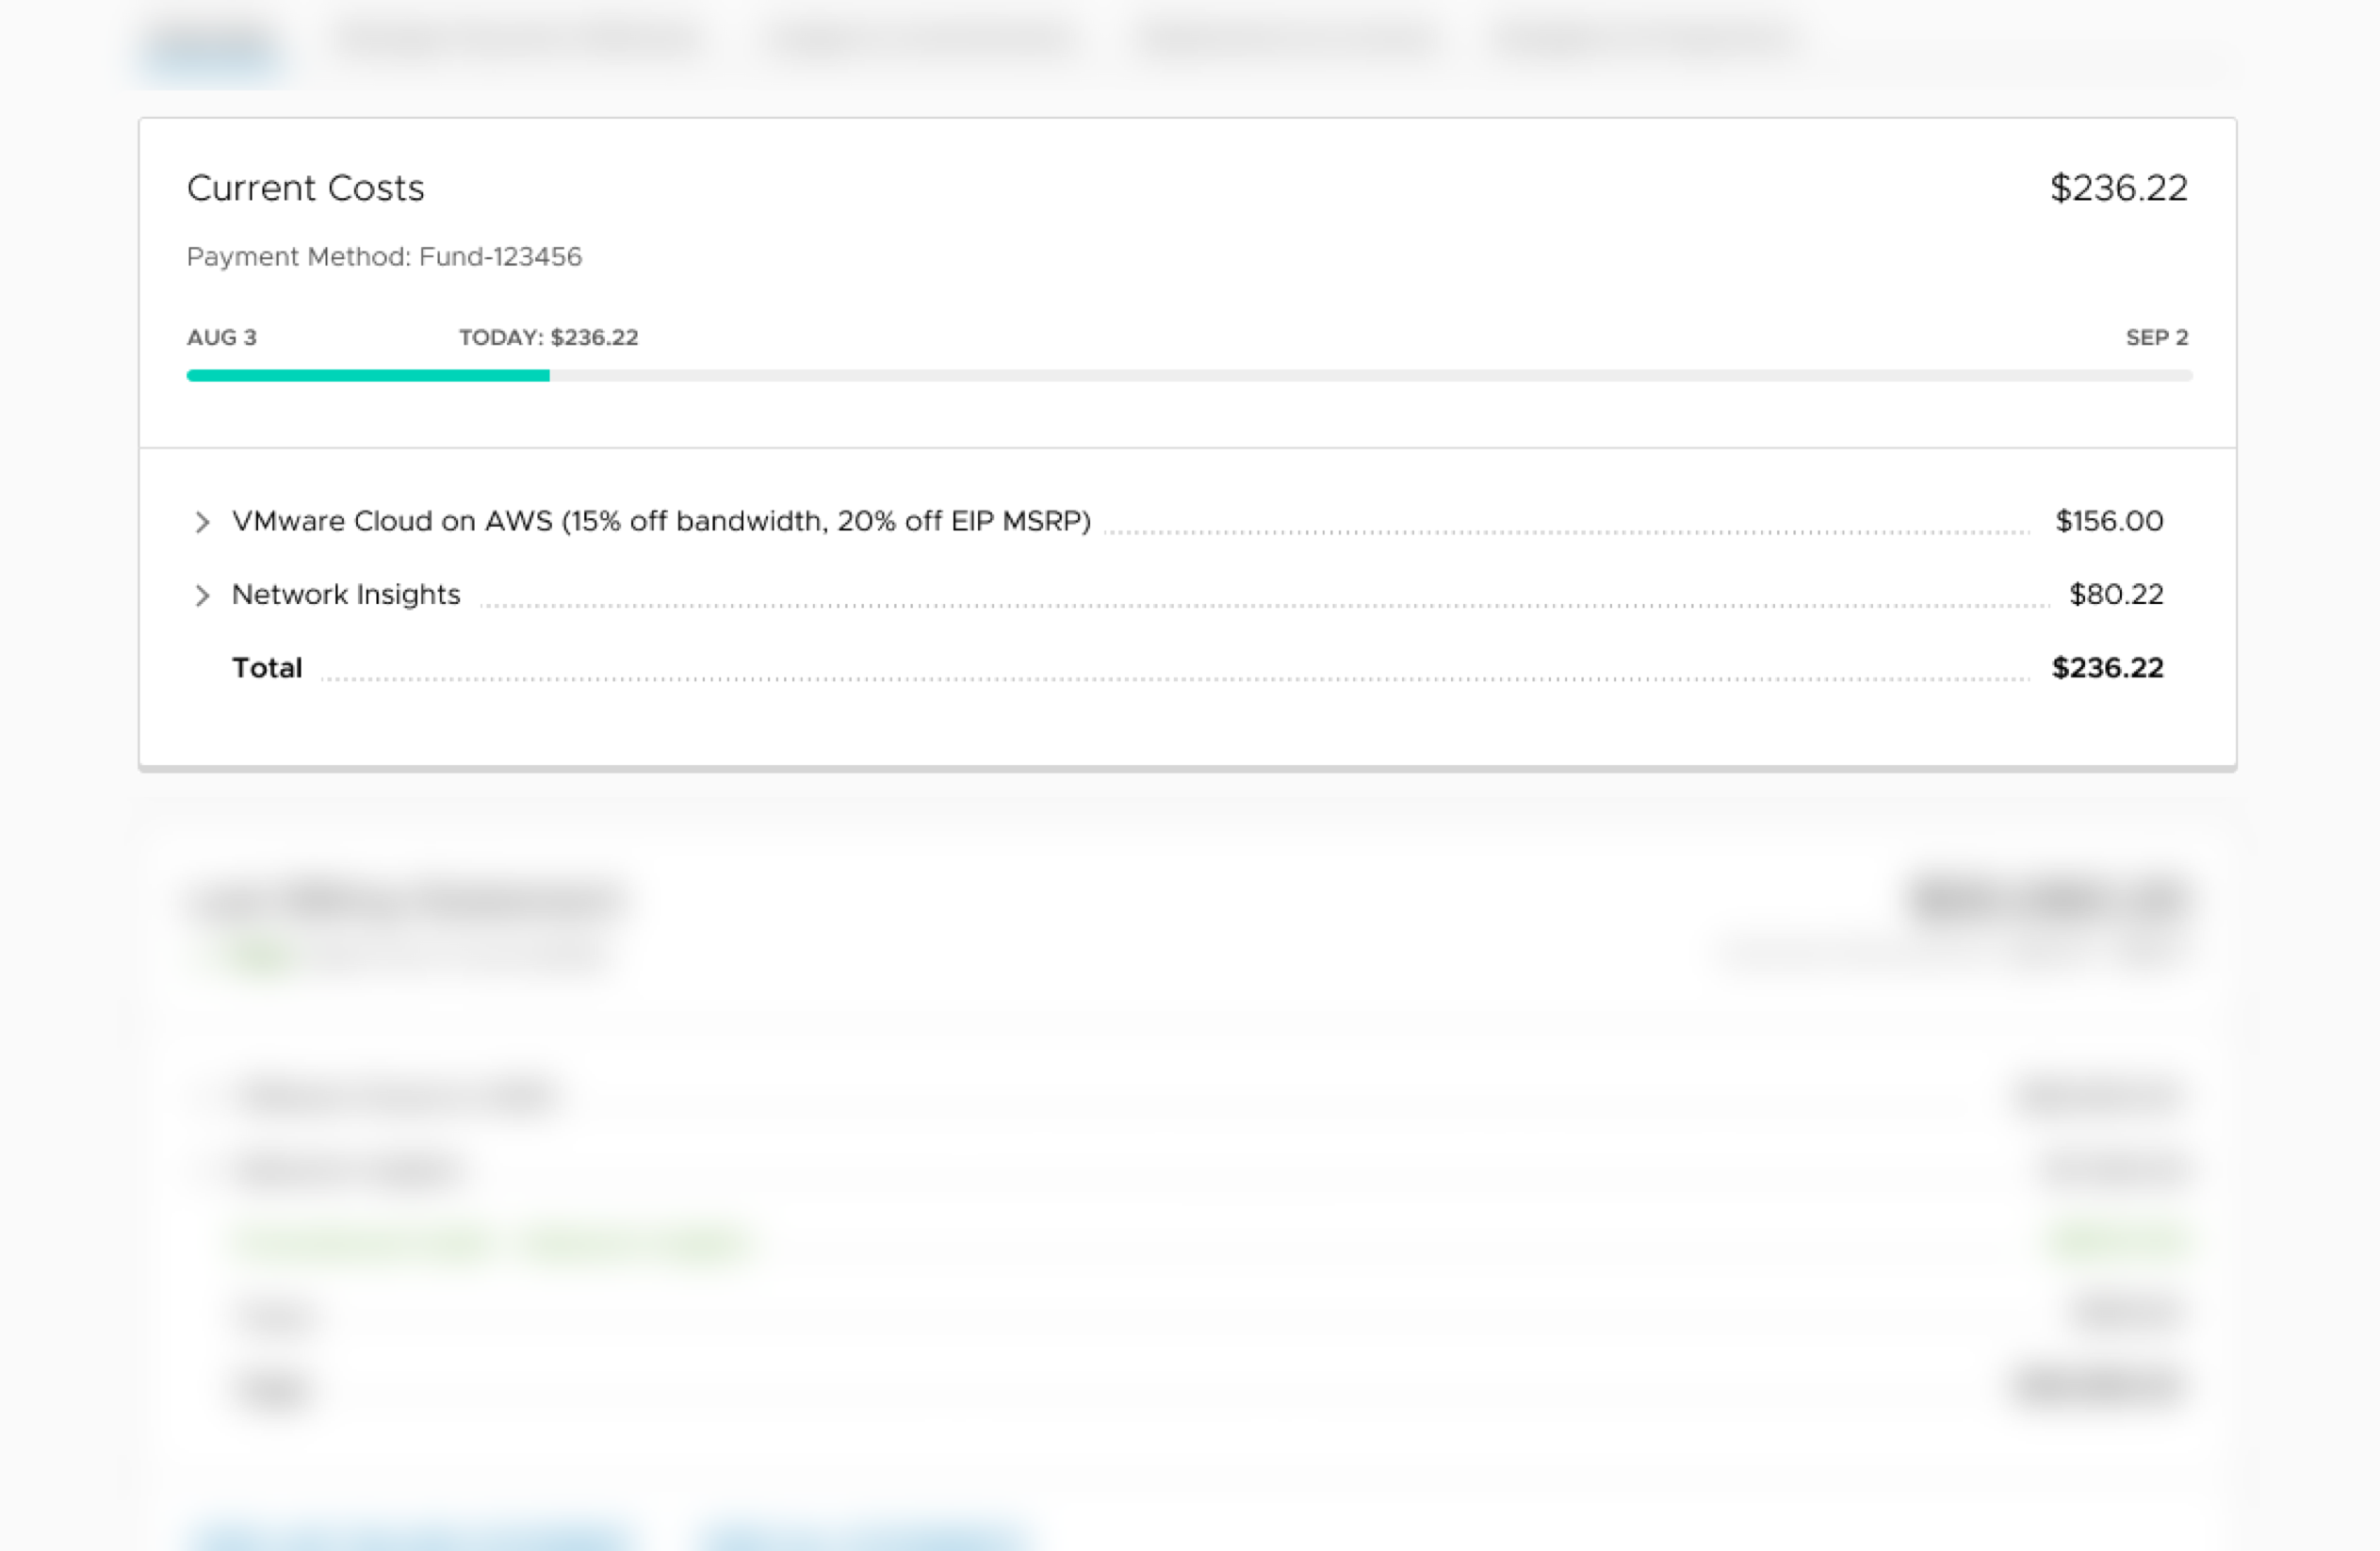
Here, from the main overview, users can view charges at an aggregate …
… then click in to view more details on specific charges from services. That pattern works across other views, as well
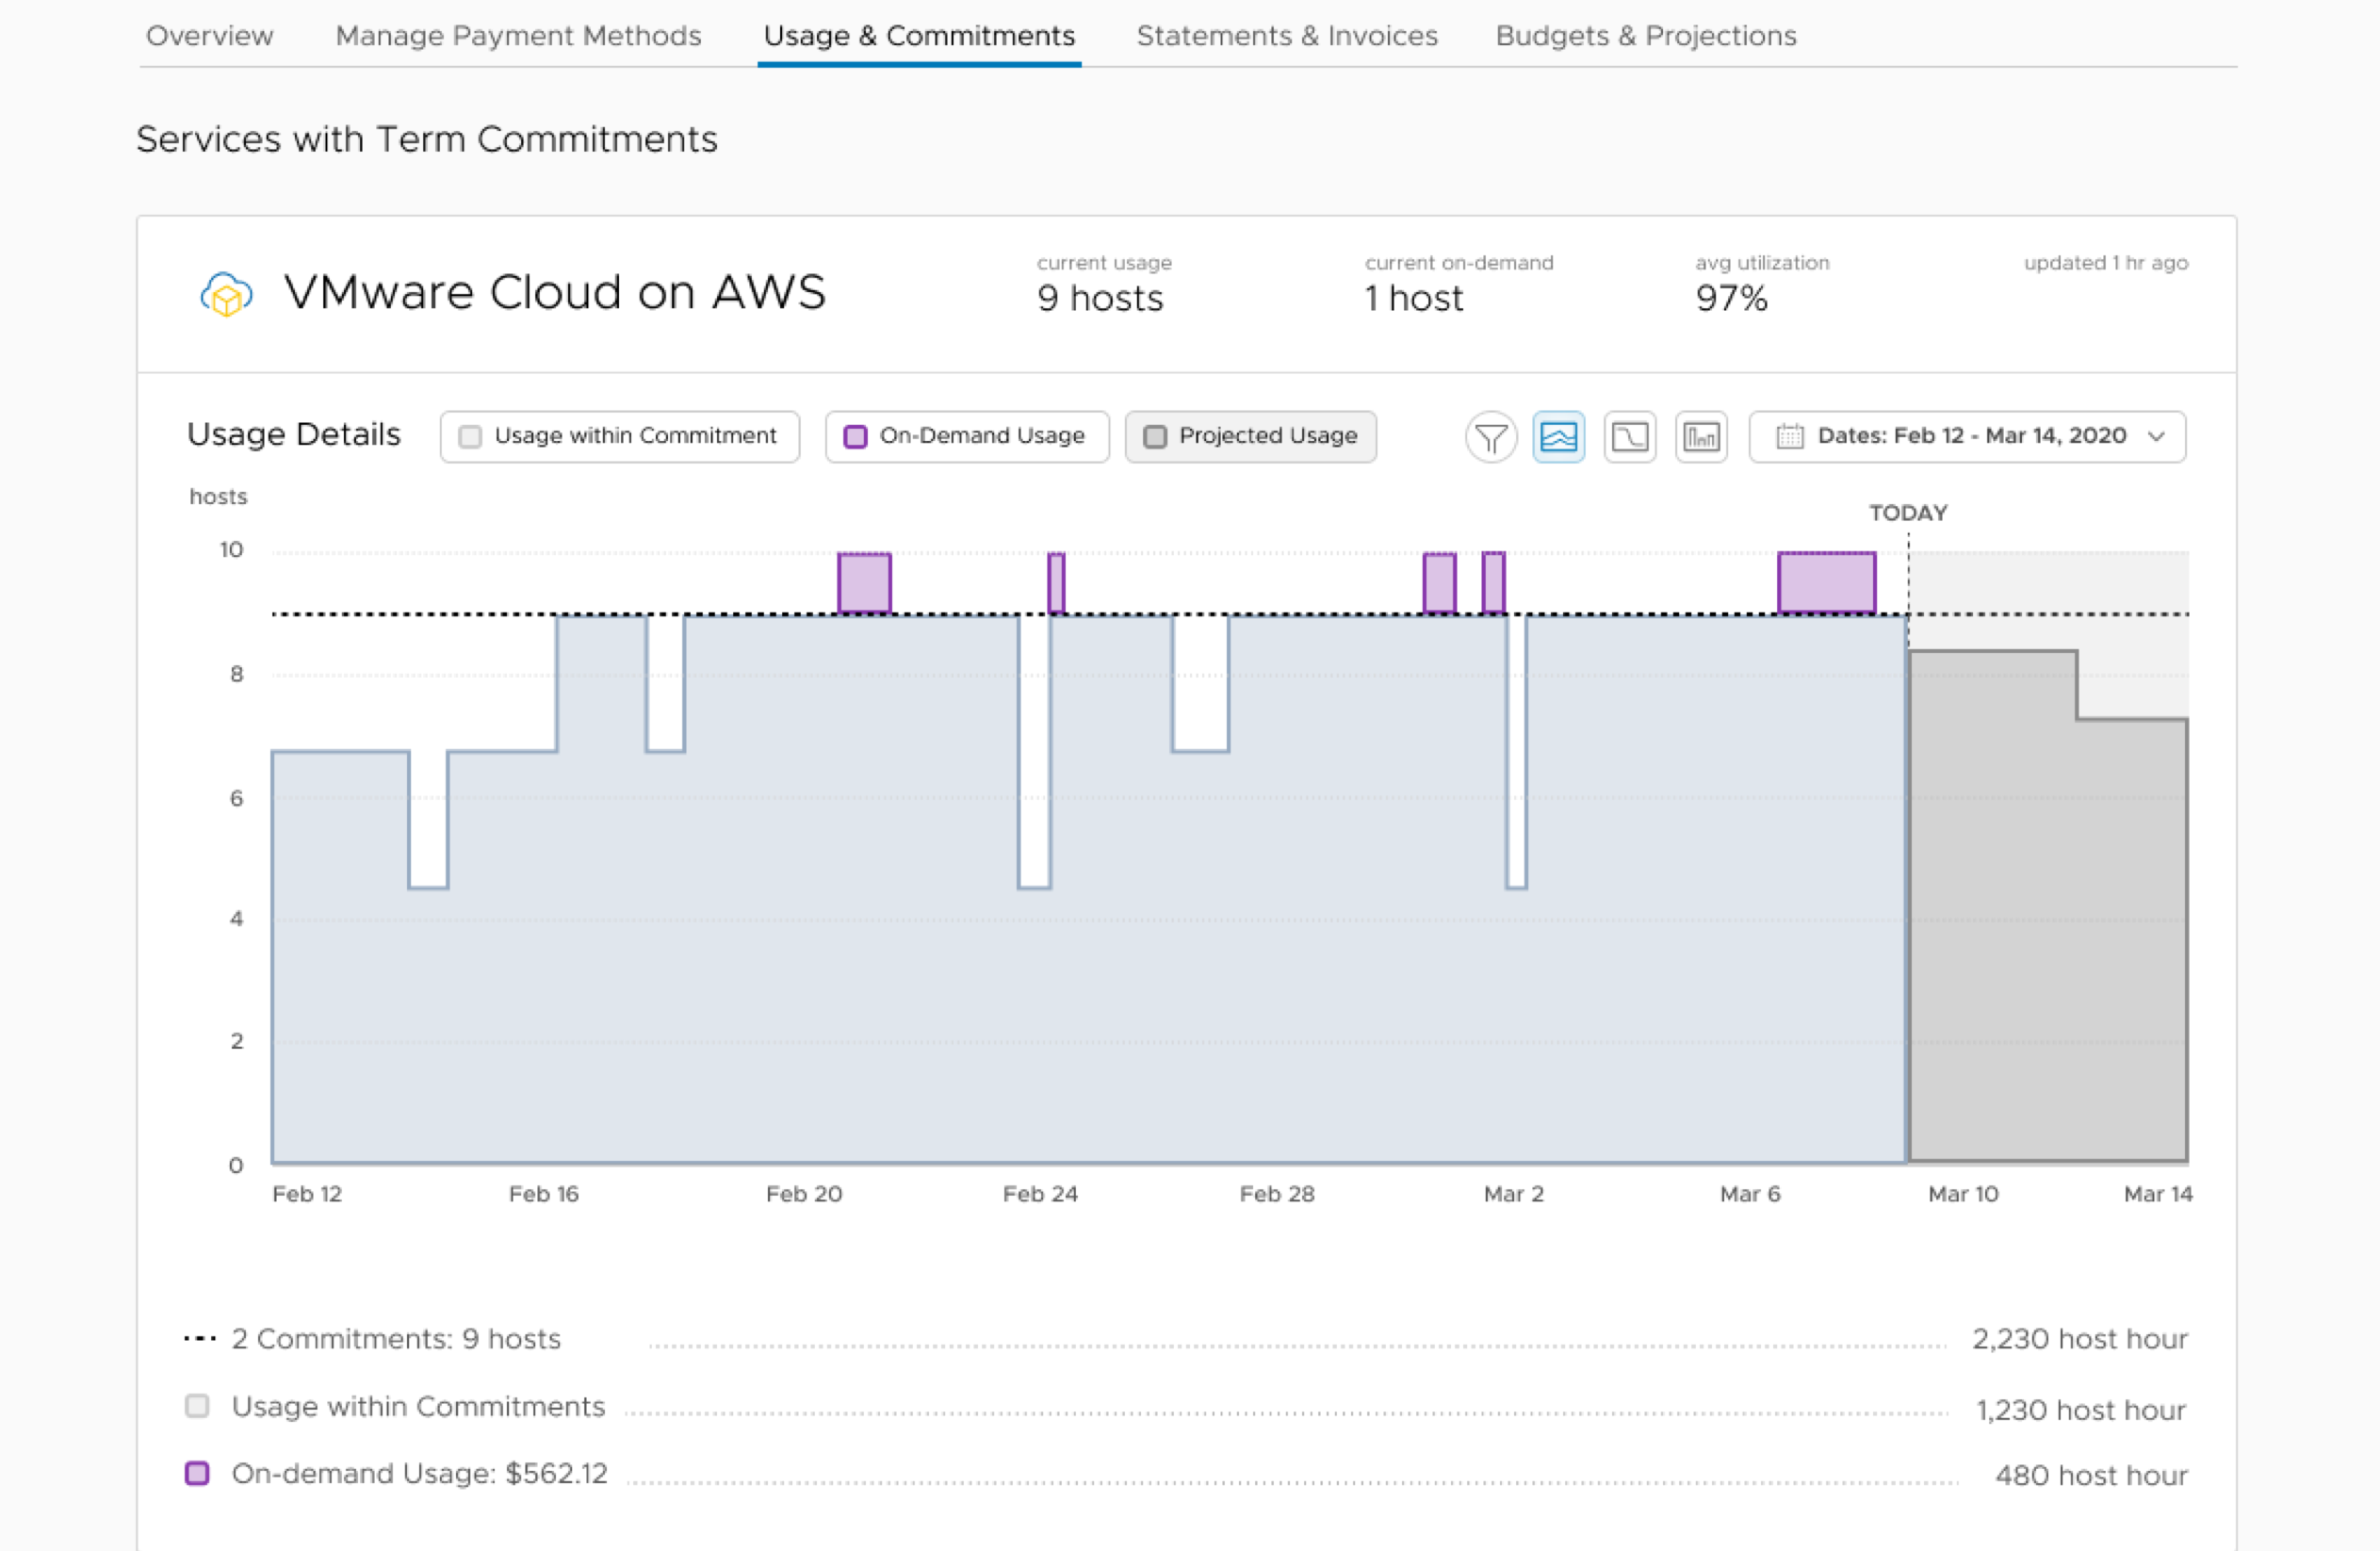
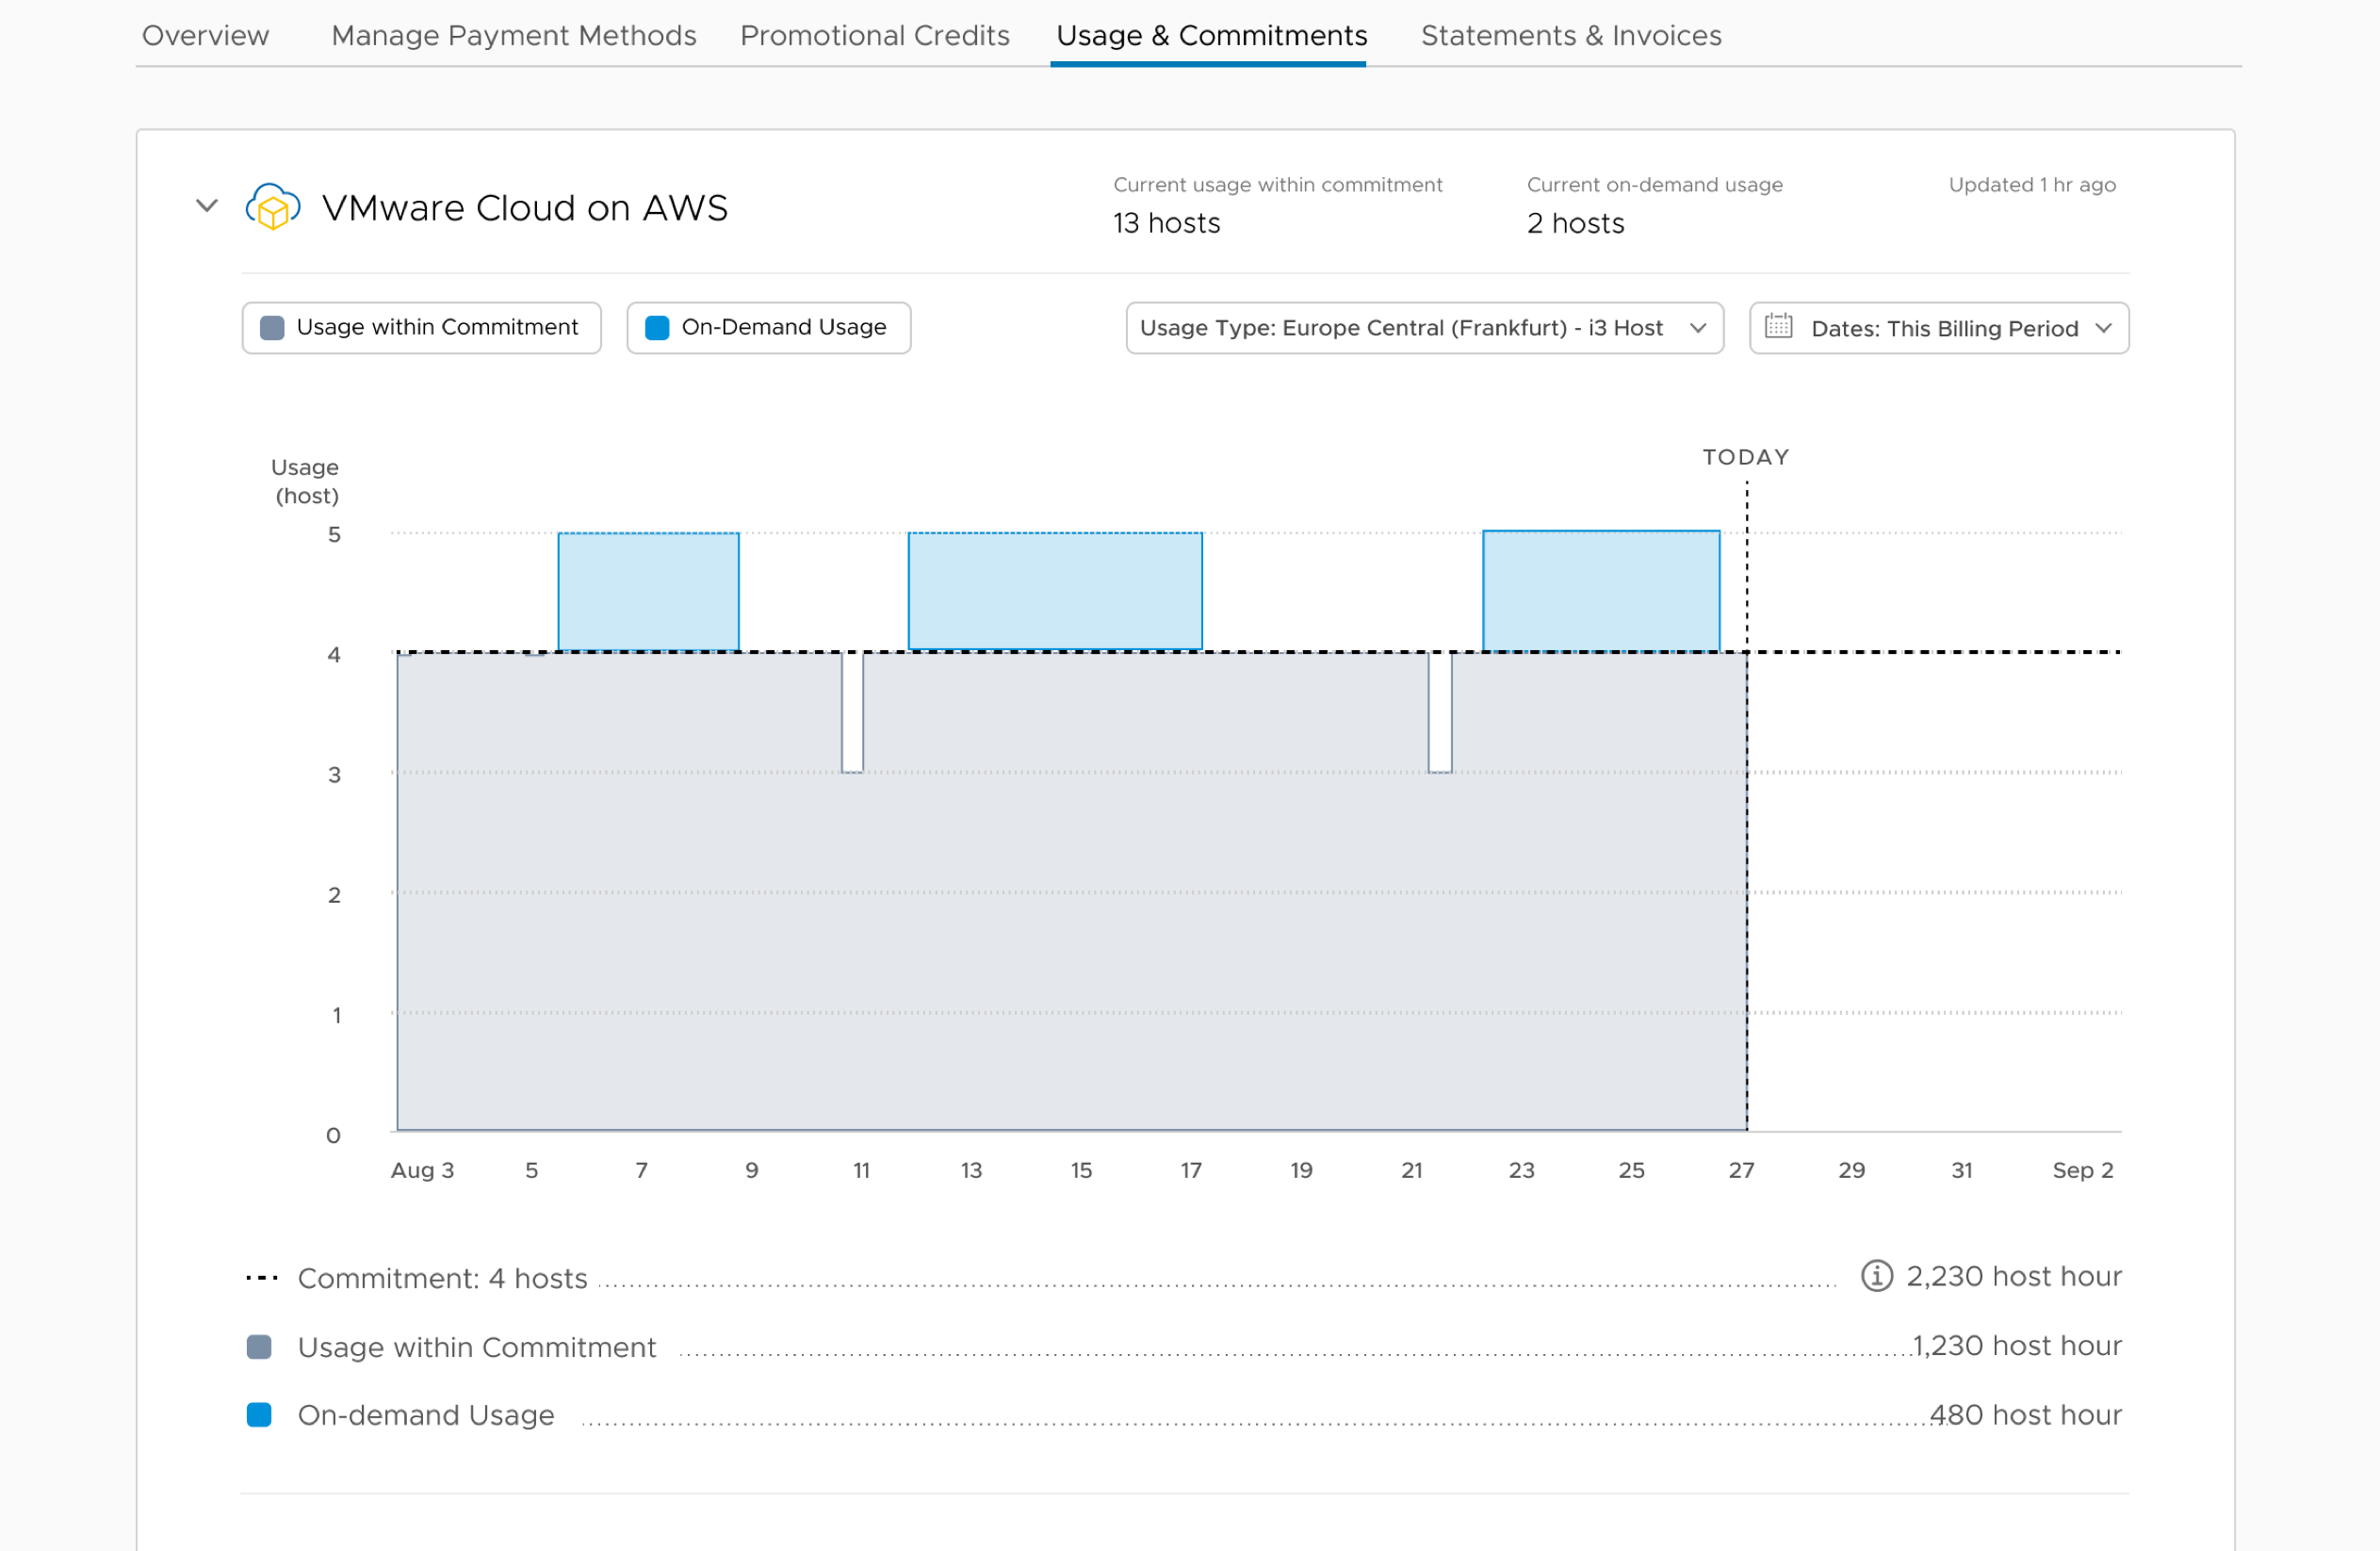
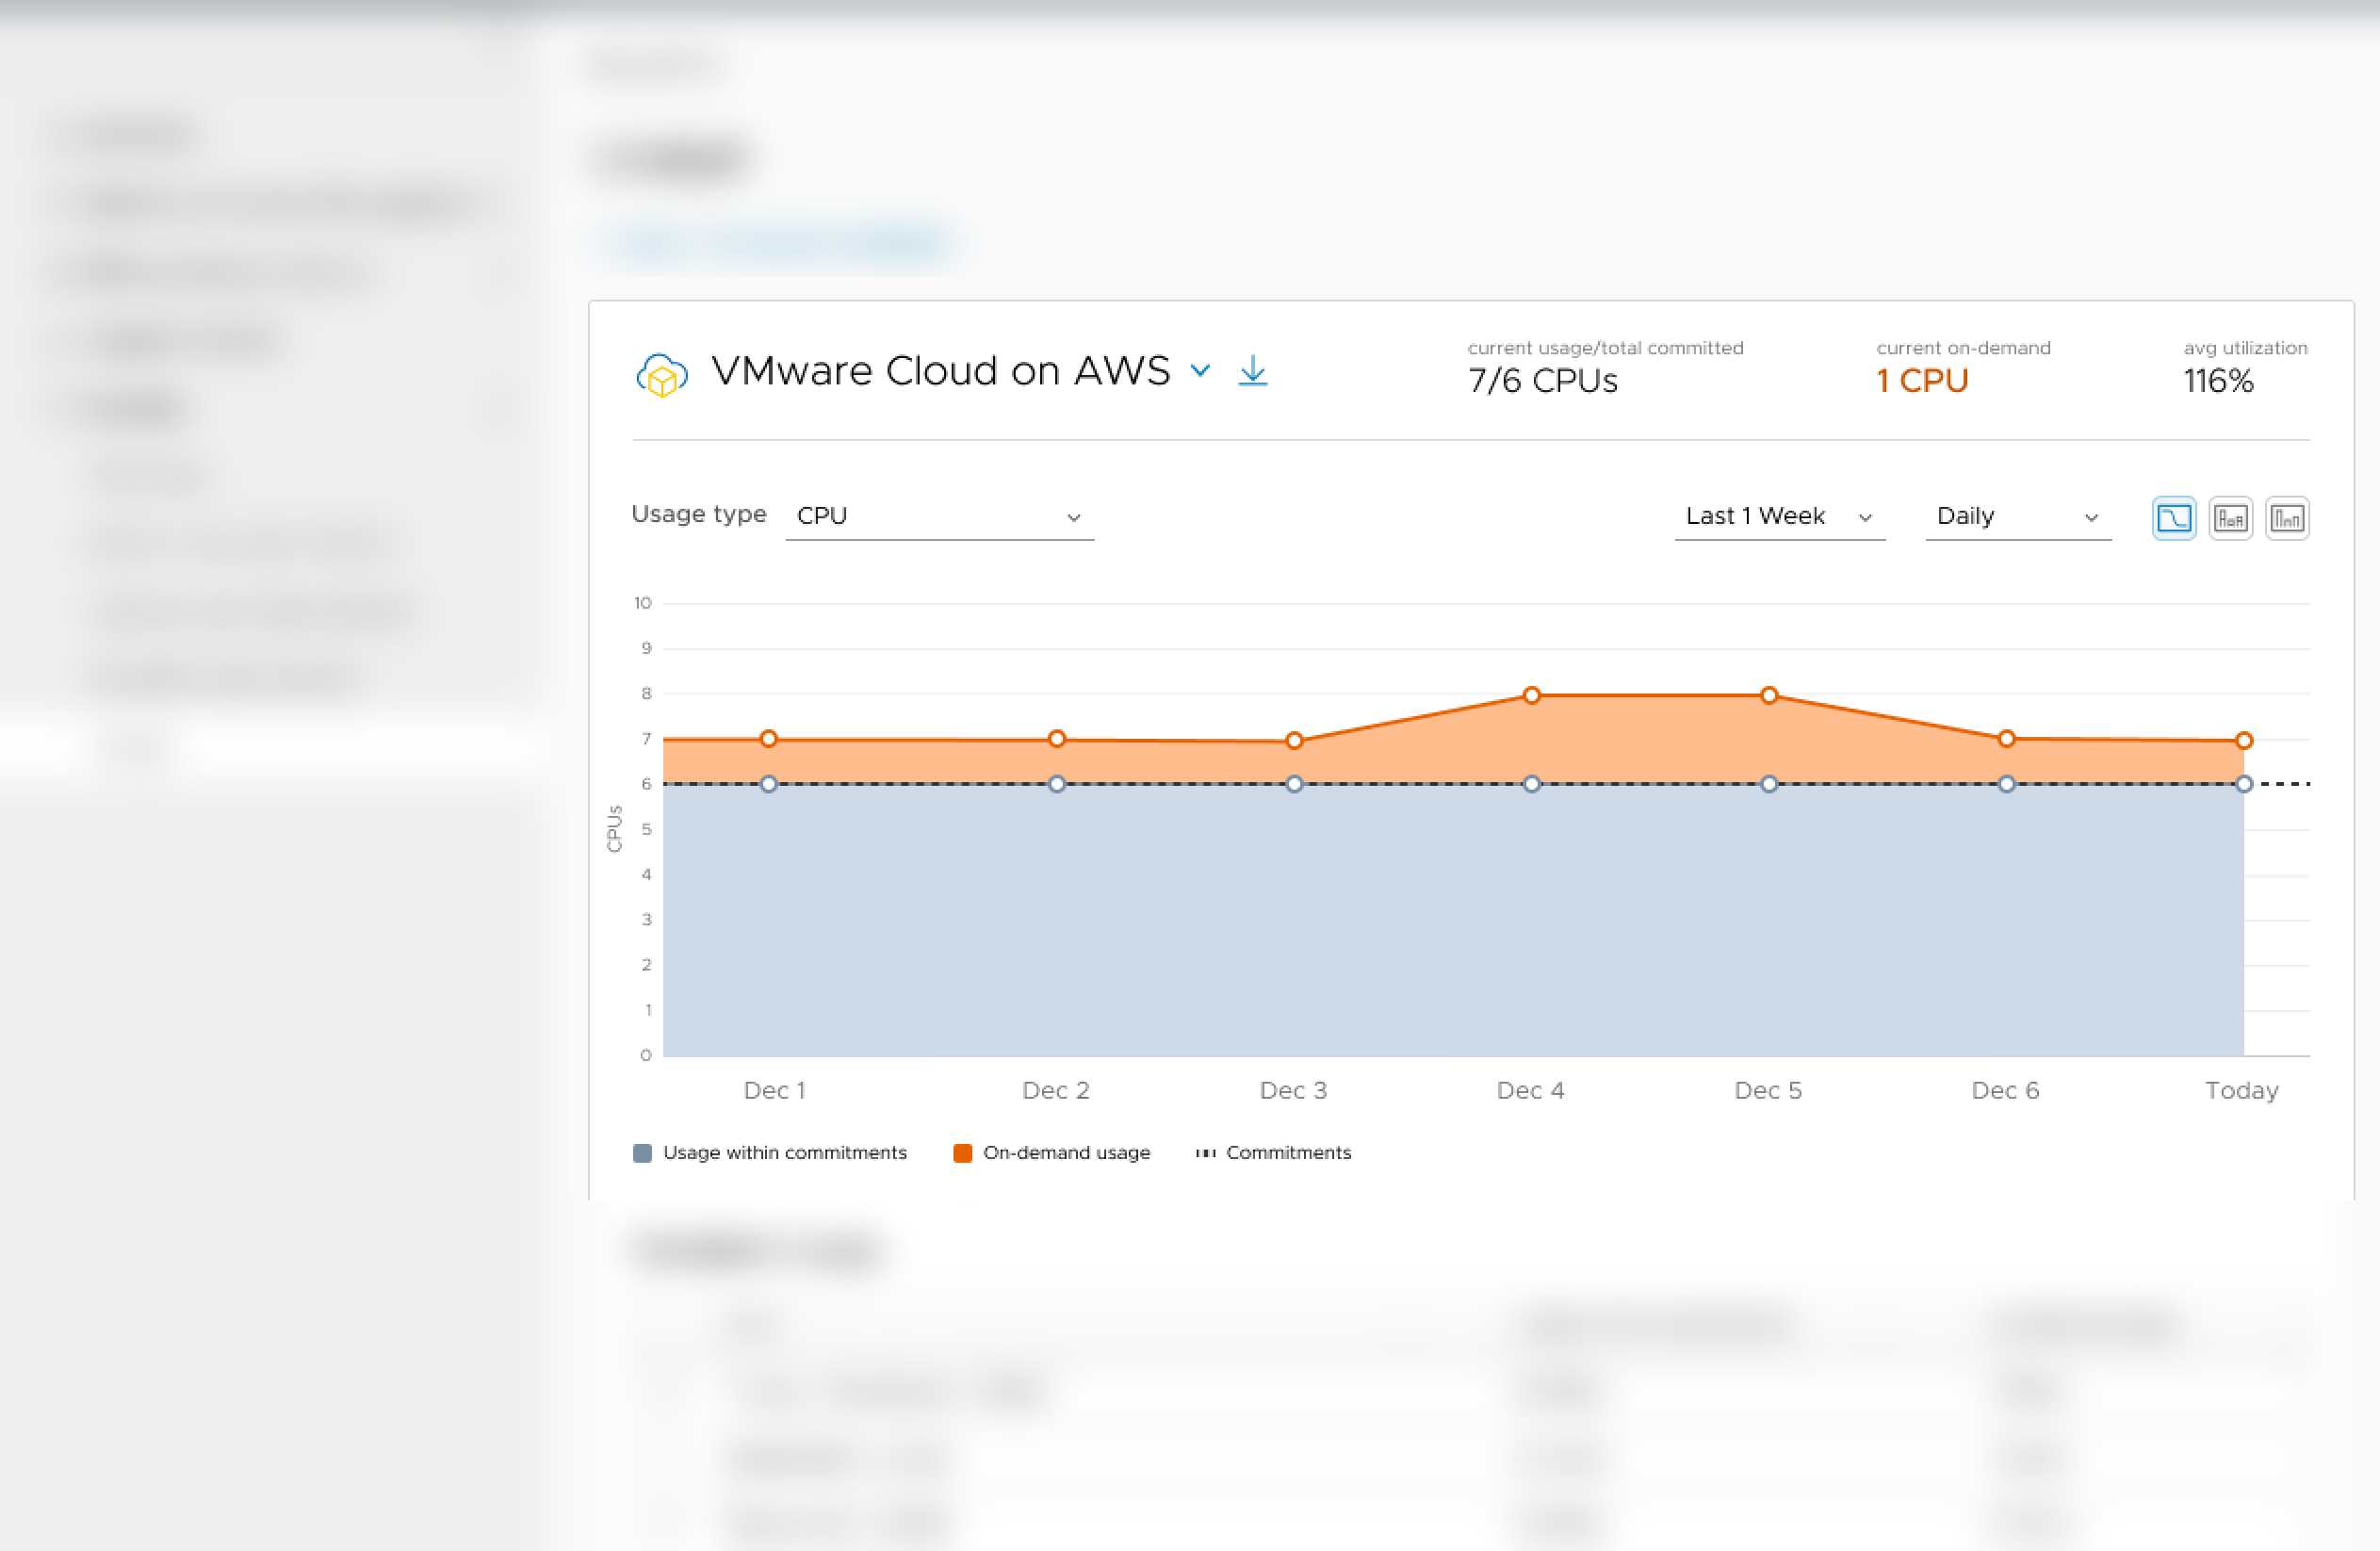
This view enables viewing what I’ve used versus what I’ve paid for
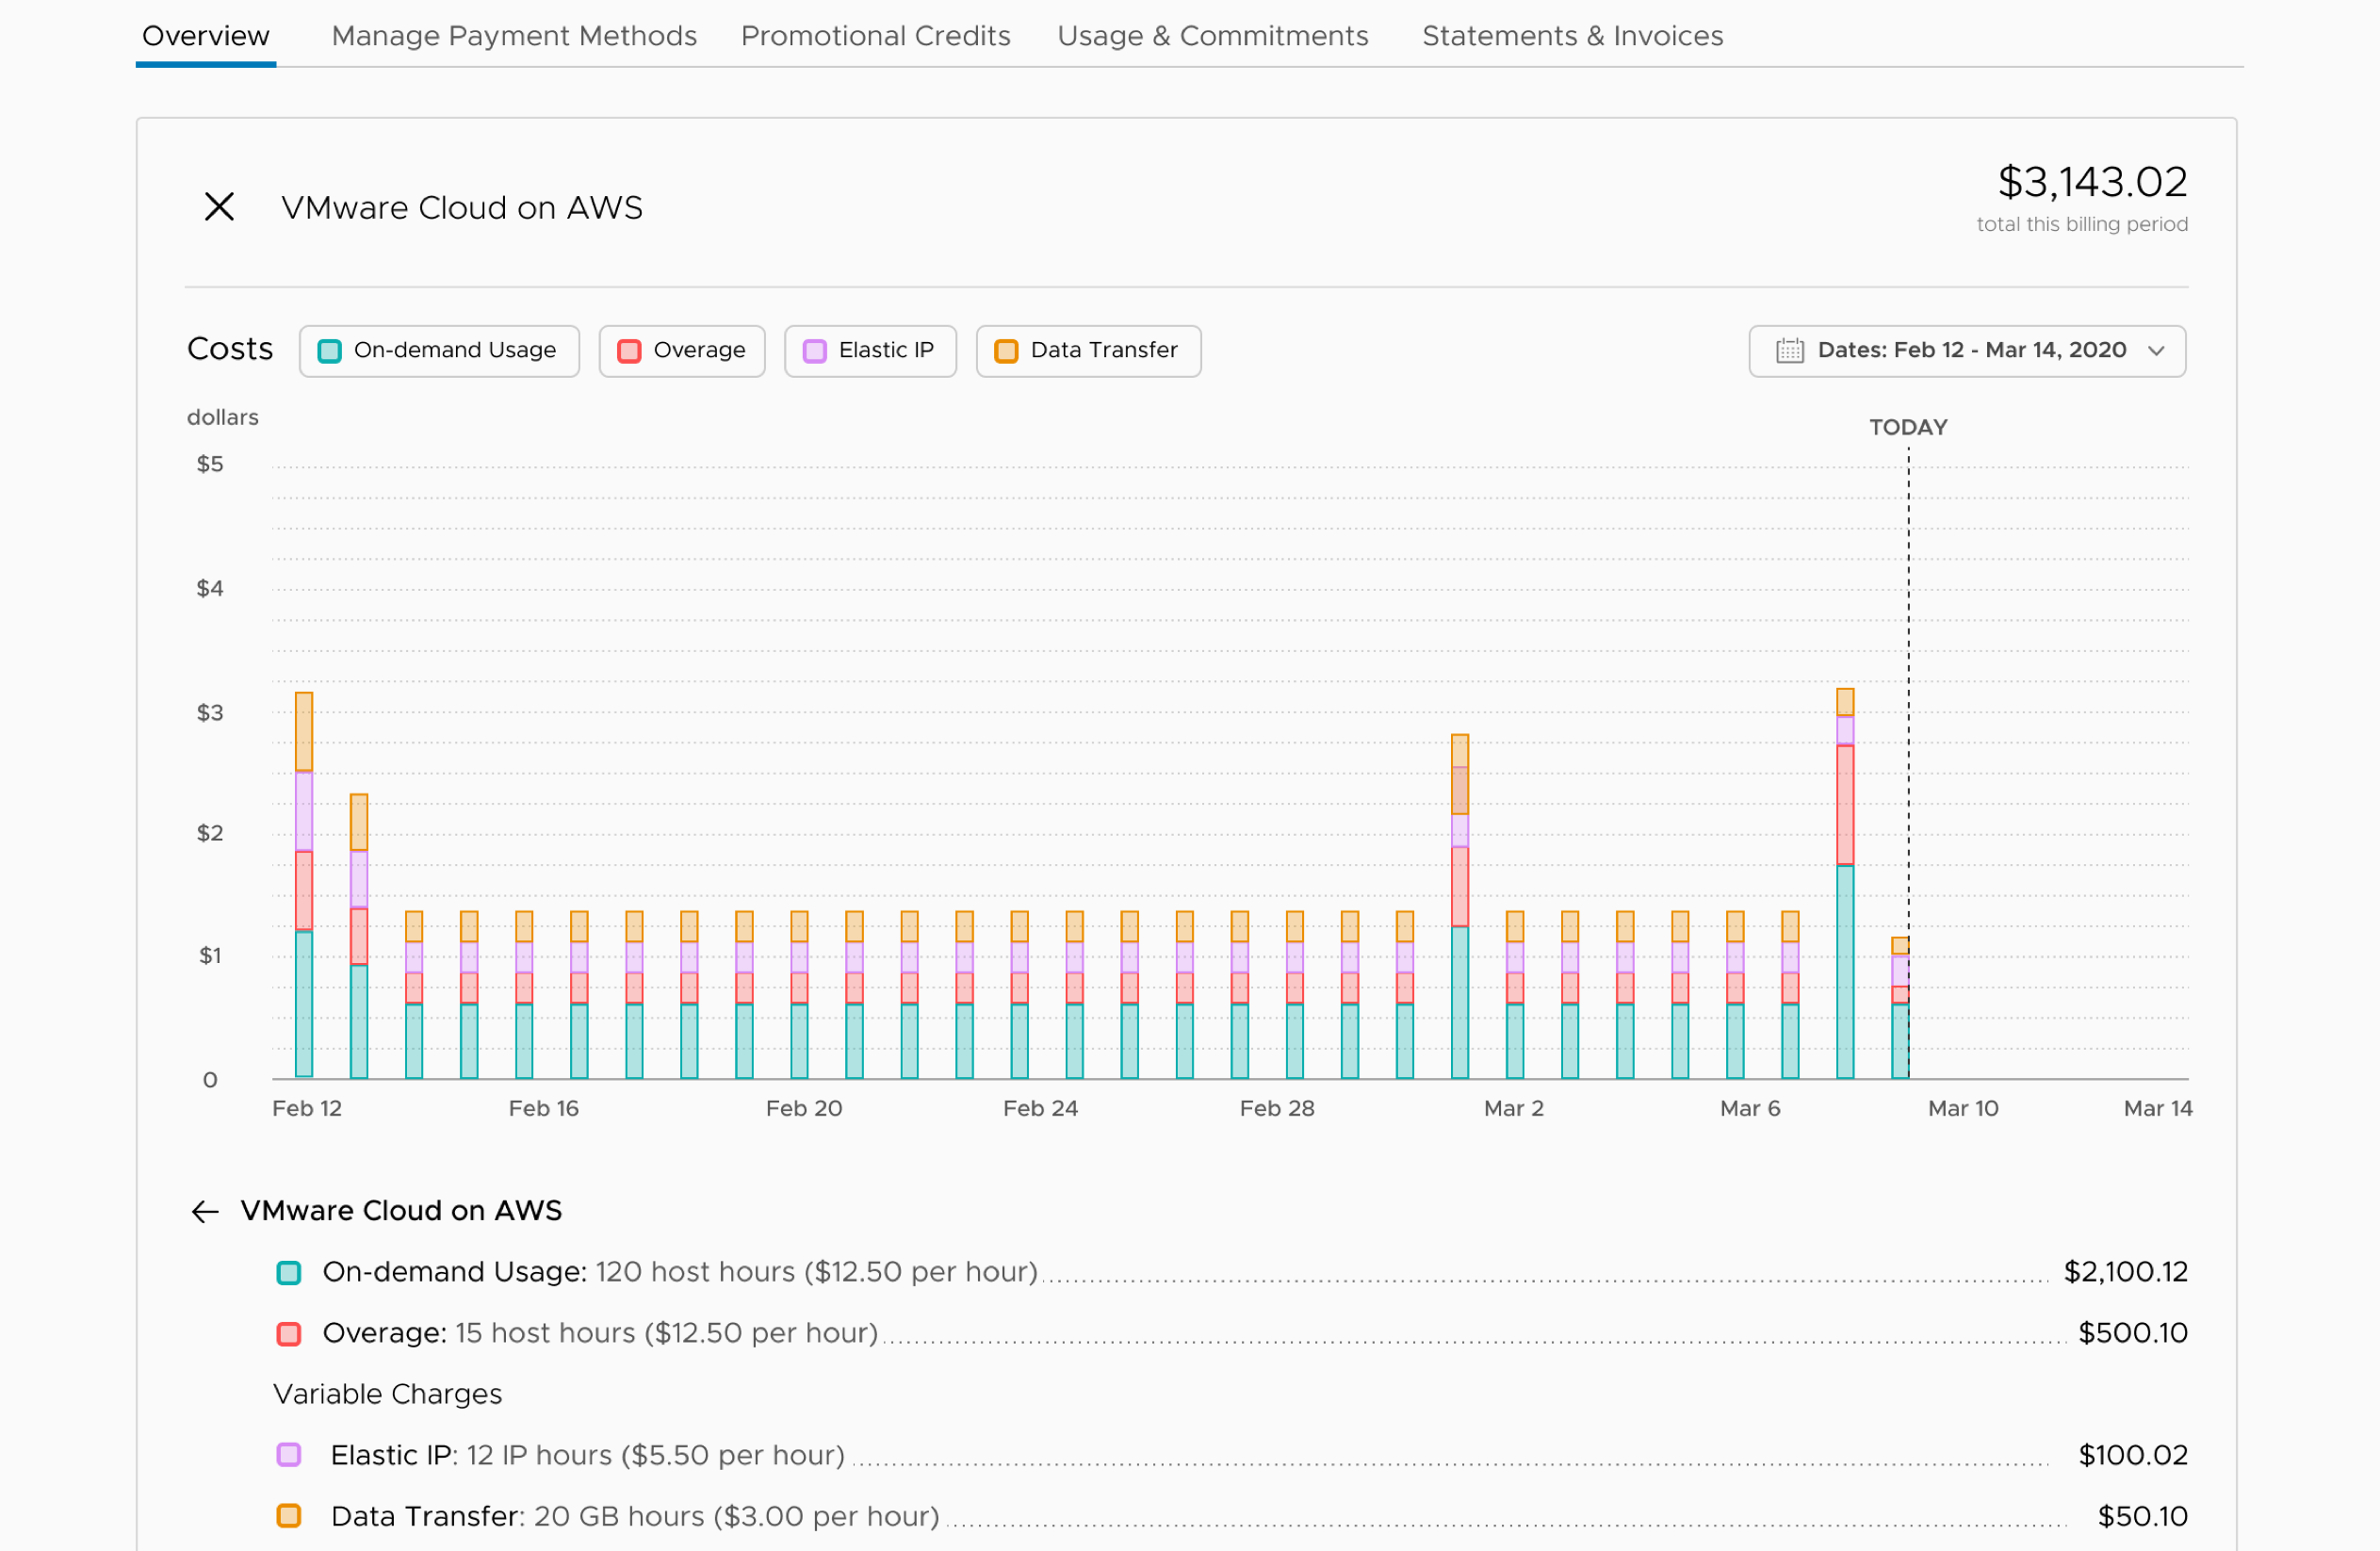
Similarly to the overview, users can go from high-level, aggregate information …
… into more details about specific charges
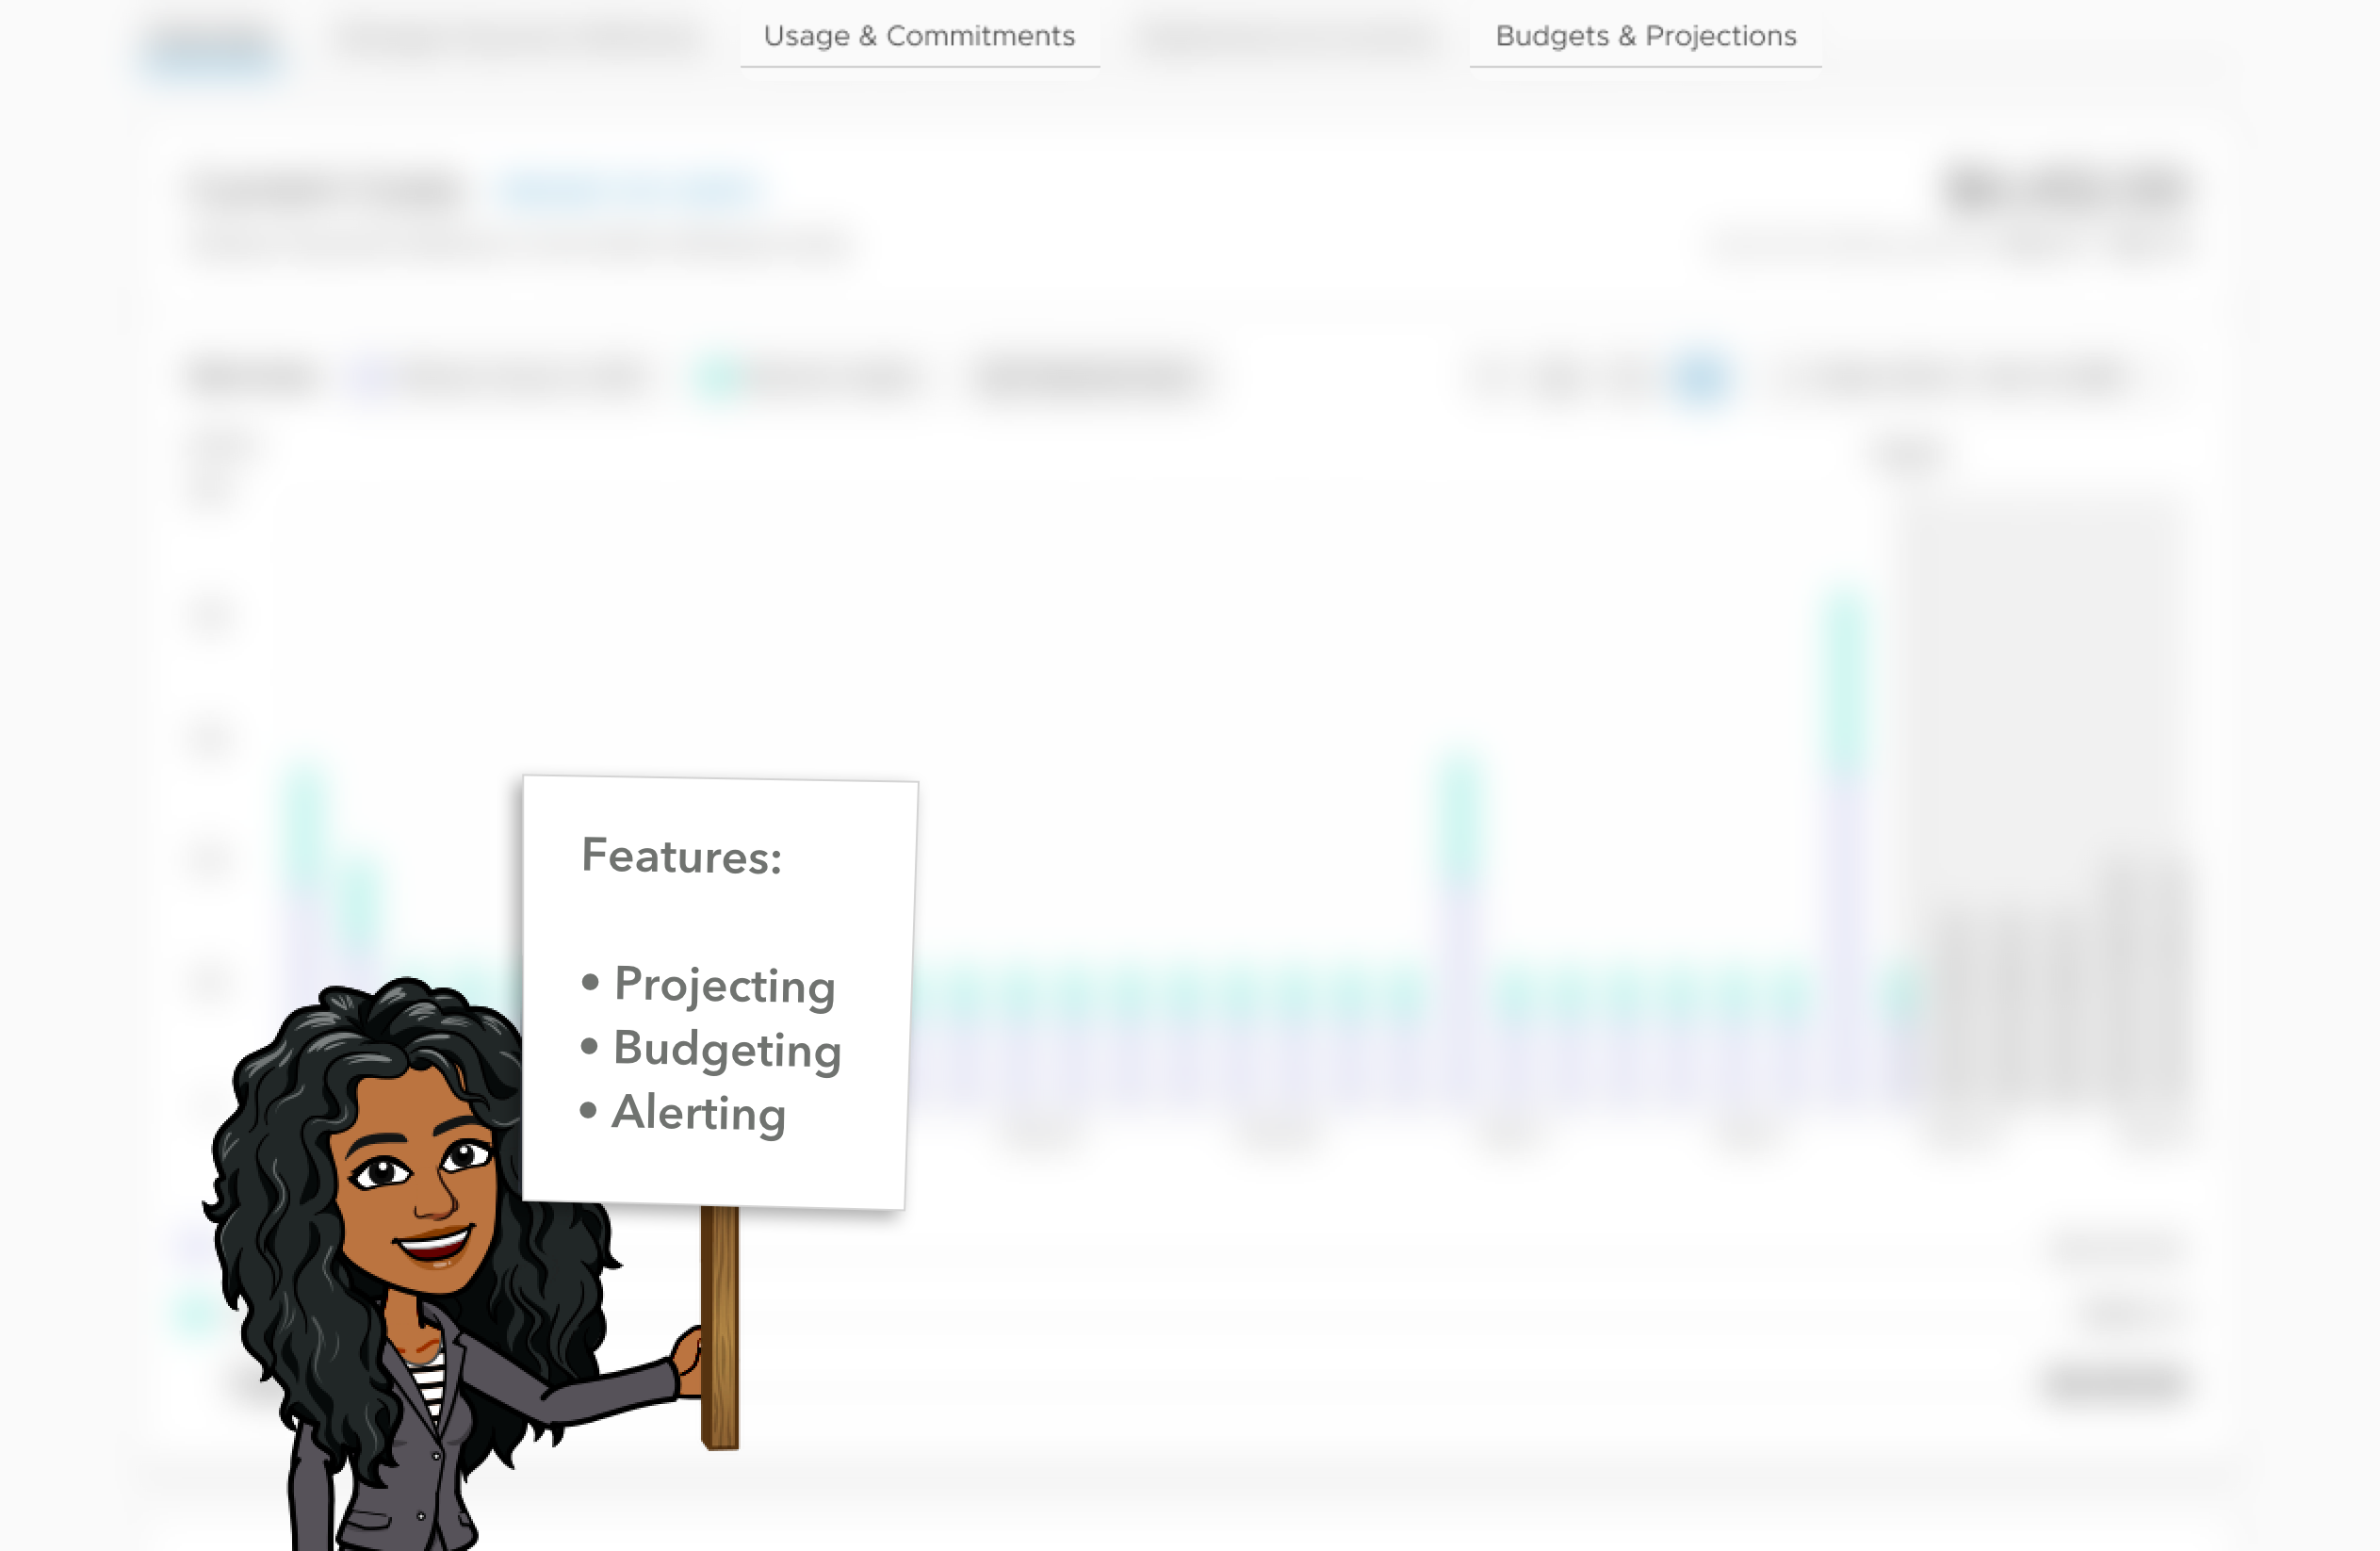
Both views integrate a new feature — projecting — into broader billing improvements addressing customer

When crafting the design vision, I collaborated with PM to understand what features we needed and why …
… while also thinking about how those features can be better integrated to set our product apart
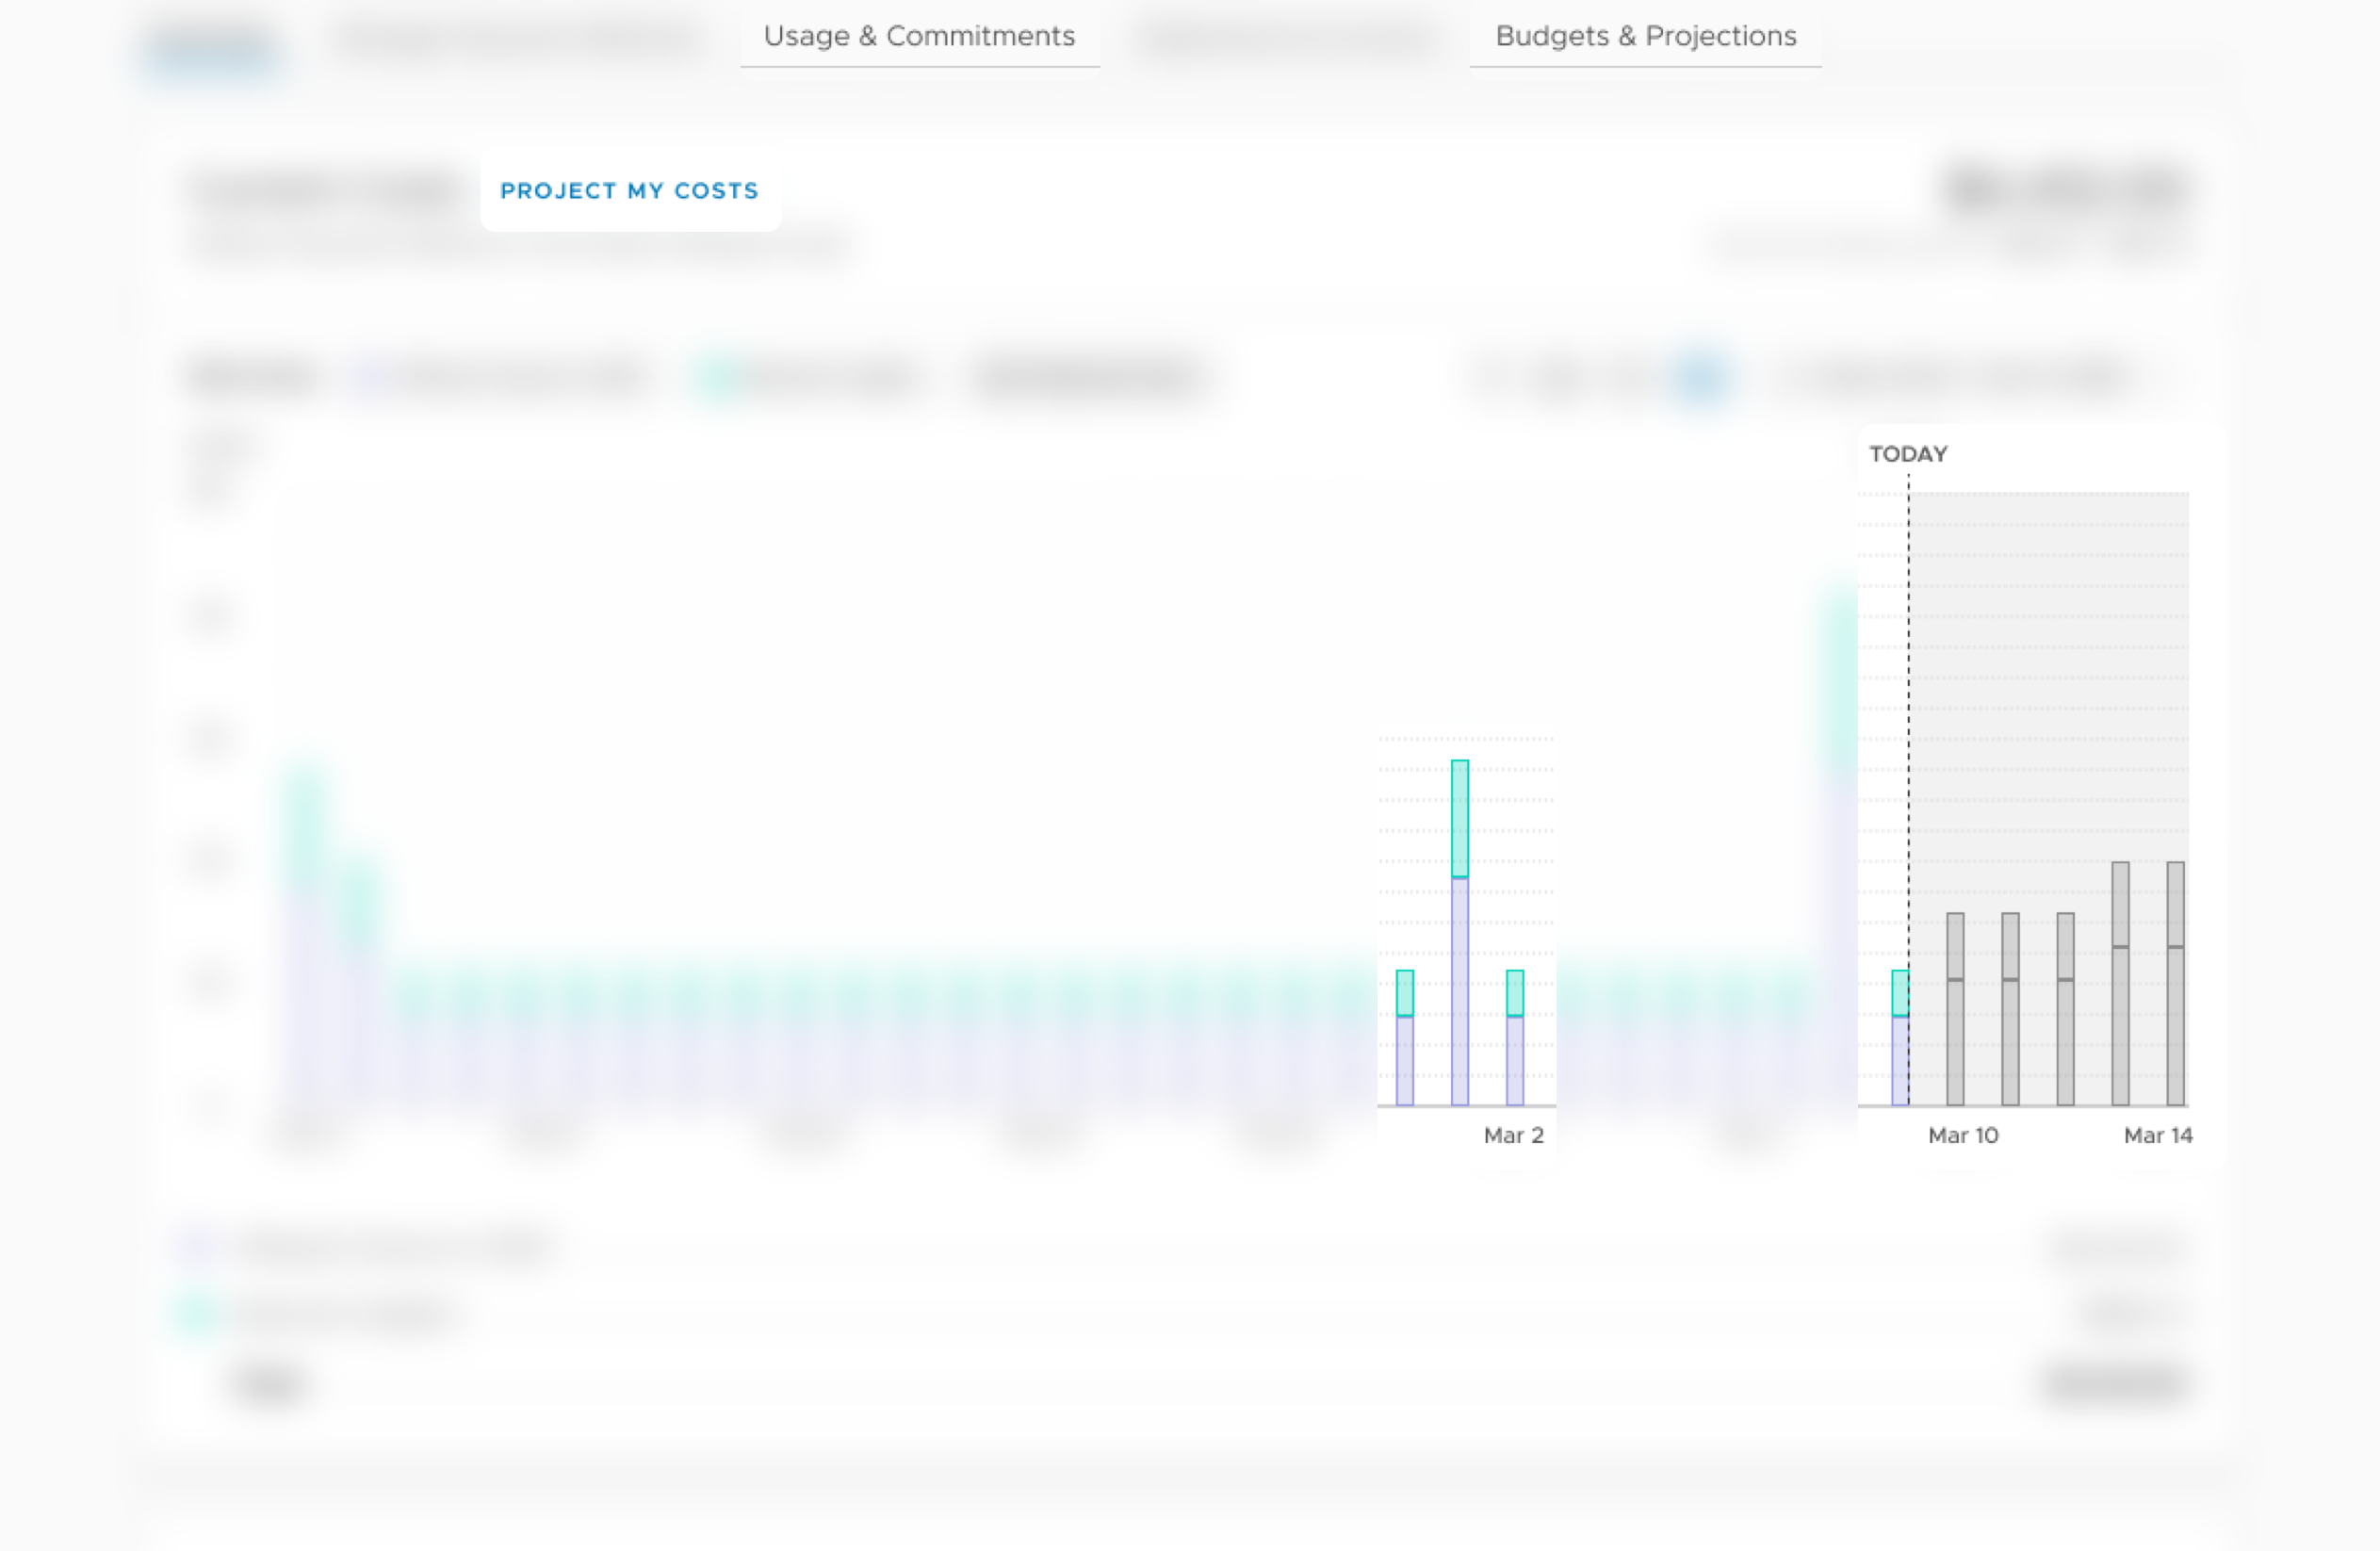
When scoping the MVP, I collaborated to understand how we could deliver immediate value towards the vision
The final MVP delivered the ability to drill into specific points in time, while setting the stage for budgets and projections in the coming release
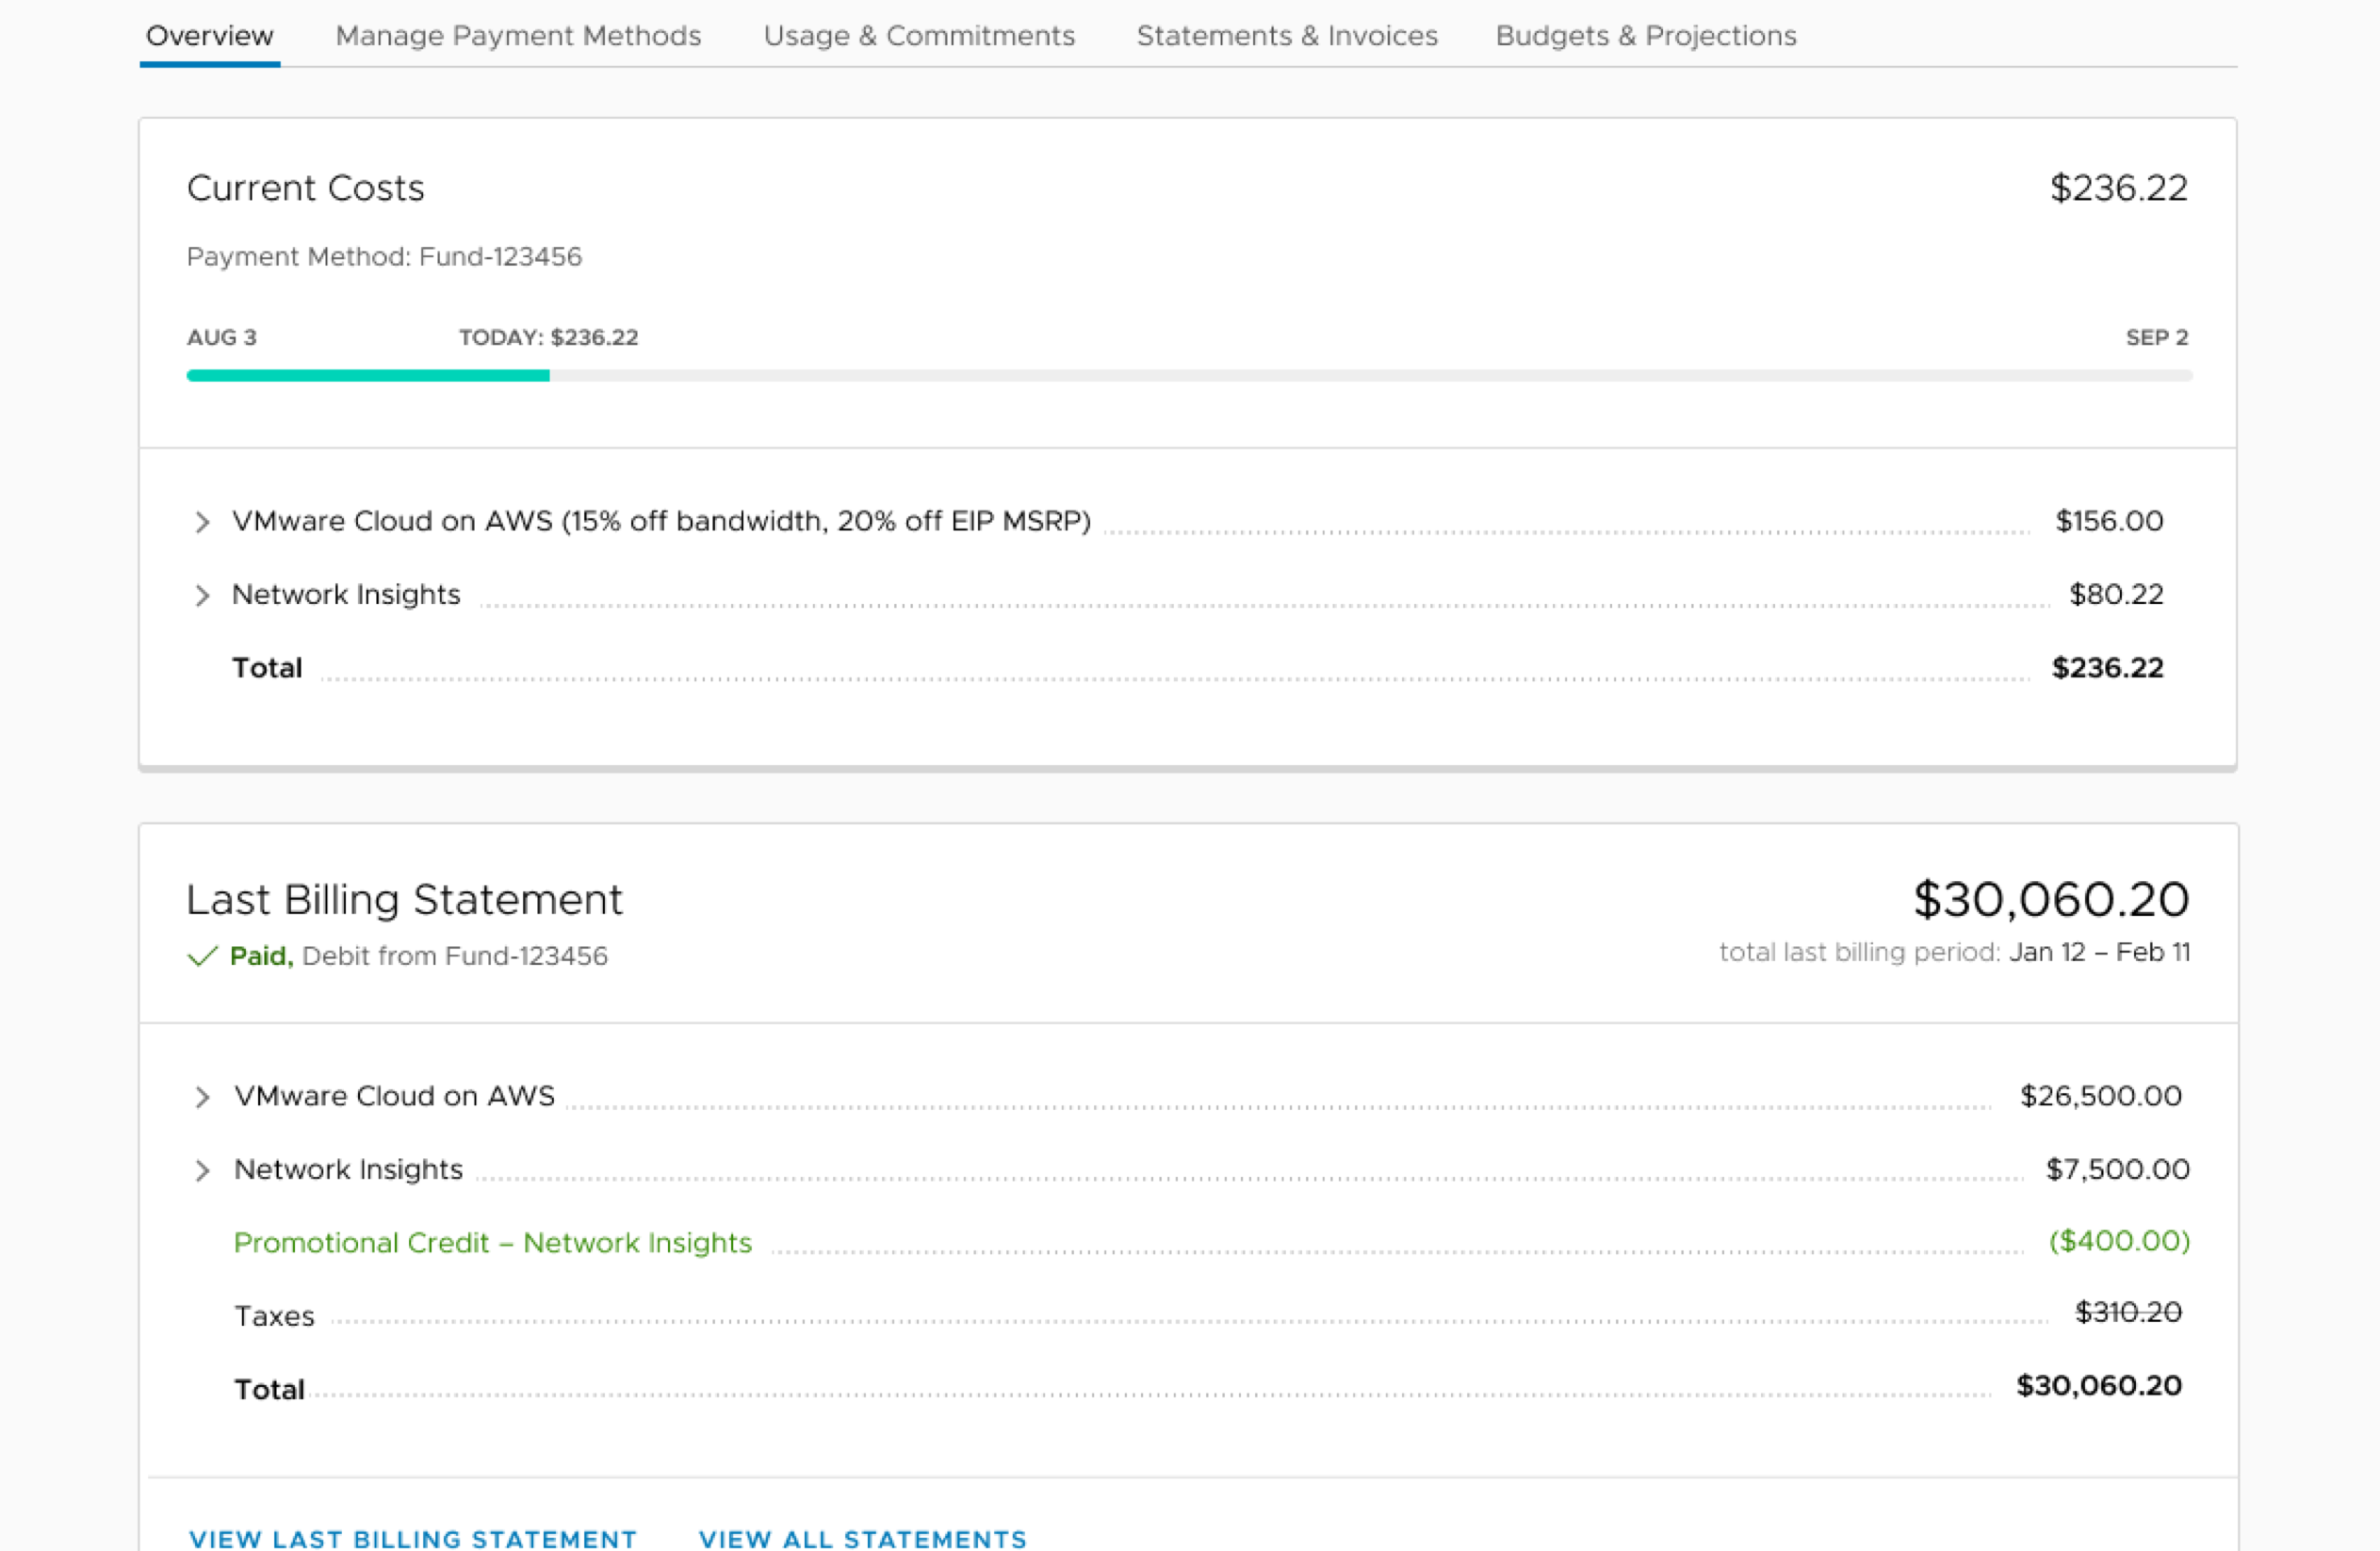
The MVP for the main “Overview” surfaces a similar aggregated billing view …
… and ability to drill into more detailed information
I helped re-architect the initial bare bones implementation, shown here
Into an interaction pattern that solved customer pain points …
… while also tying together future features within a design vision
While some of the visual elements have changed, the architecture setup a firm foundation for future releases, shown here

The Work
Solutions to identified pain points
 Define
 Design
 Discover
 Deliver
Specifically, I compiled …
- Internal Research
- Competitive Research View Examples
- Market Research
I then…
- Explored Design Solutions
- Whiteboarded with Colleagues
- Created Hi-Fidelity Prototypes
Specifically, I …
- Collaborated with the Research Team View Examples
- Conducted 1:1 Usability Testing View Examples
- Synthesized the Findings for Stakeholders View Examples
When finalizing the project I …
- Collaborated with Developers to Implement Interactions
- Documented Guidelines for Other Teams
- Monitored Performance Metrics on Release


I leverage a four step iterative process. Define, Design, Discover, Deliver
When defining, I look to define the problem from the user, the market, and the business perspectives.
Depending on the stage of the project, I'll then make some designs. If its early, I'll be working on high level designs; if later, I'll create something higher fidelity.
I'll then test the solution with some users and synthesize the findings.
When delivering, I'll work cross-functionally to unblock edge cases, ensure success metrics are captured, and collaborate to implement delightful interaction.
The Process
The process I follow, and how I used it to deliver this project


I collaborated closely with my core product team to define a design vision that solved for needed features and user pain points
… specifically, I worked closely with PM to define how the user-driven design vision could align with the feature roadmap
And users have responded positively to many of the product enhancements
Finally, I collaborated with a junior designer to deliver subsequent projects …
… here, for example, we collaborated to define how the data visualization pattern could translate into a paper document
While maintaining cohesion within the broader design vision and its system of delivering information


The Results
What came out of the work

Thank you!
I appreciate you taking the time to check out my work